Field goal percentage is the stat we all learned first, and it's the one that quietly lies to us the most. It treats a wide-open dunk and a step-back three as the same event, and it pretends free throws never happened. True Shooting percentage fixes all three problems at once — and once you start reading it, the box score never looks the same.
Why field goal percentage lies
Imagine two guards. One goes 8-for-16 on twos for 16 points. The other goes 6-for-16, but all six are threes, for 18 points. Field goal percentage says the first guard (50%) is the better shooter than the second (37.5%). The scoreboard disagrees: the second guard produced more points on the same number of shots. Field goal percentage can't see the extra point a three is worth.
Then there's the foul line. A player who drives, draws contact, and sinks two free throws has produced two points and taken zero "field goal attempts." As far as FG% is concerned, that trip down the floor is invisible. For players who live at the line, that's a huge chunk of their scoring erased from the efficiency conversation entirely.
The True Shooting formula
True Shooting percentage rolls twos, threes, and free throws into a single number that answers one question: how many points did this player generate per shooting possession? The formula looks intimidating and is actually simple:
True Shooting %TS% = PTS / (2 × (FGA + 0.44 × FTA))
The denominator estimates how many scoring possessions a player used. Every field goal attempt is one. The 0.44 coefficient converts free throw attempts into possession-equivalents — most trips to the line are two shots, but some are one-and-ones, three-shot fouls, or and-ones, and 0.44 is the league's long-run average cost. Multiply by two because a "normal" possession that ends in a made two-pointer yields two points, and we want 50% to mean "league-average two-point efficiency."
Here's the same math with a real line. This past season the league's leading scorer, Luka Dončić, averaged 33.5 points on 22.8 field goal attempts and 10.1 free throw attempts:
Worked example — Luka Dončić, 2025-2633.5 / (2 × (22.8 + 0.44 × 10.1)) = 33.5 / (2 × 27.24) = 61.5%
That matches the .616 the NBA's own data reports (the tiny gap is rounding on the per-game inputs). His field goal percentage, by contrast, was a pedestrian-looking 47.6%. Those ten free throws a night — invisible to FG% — are doing a lot of work, and that's exactly the point.
True Shooting %: PTS / (2 × (FGA + 0.44 × FTA)). Enable JavaScript to use the interactive calculator, or try our calculators page.
What the leaderboard actually shows
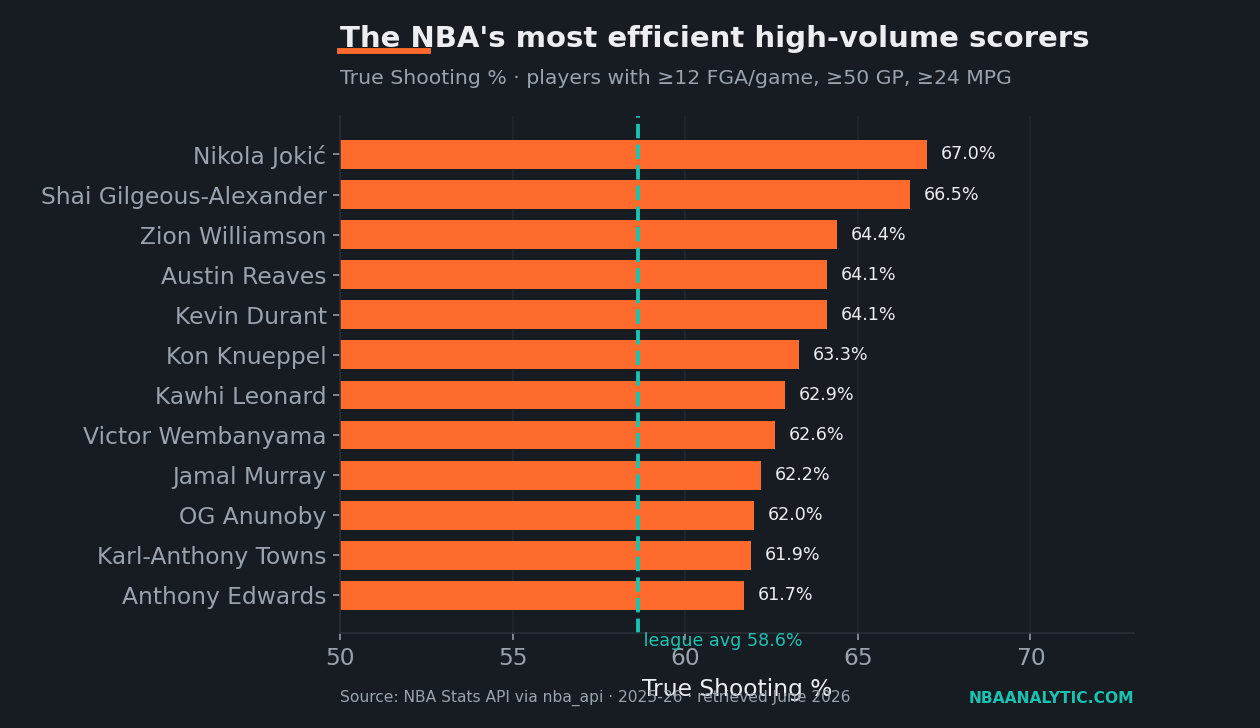
Among the 151 players who qualified as rotation regulars, the average True Shooting mark was 58.6%. That's your reference line: anything north of it is above-average scoring efficiency, and the gap between 58% and 65% is enormous over a full season.
At the top sits Nikola Jokić at a frankly absurd 67.0% on real volume, with Shai Gilgeous-Alexander right behind at 66.5% while carrying a 31-point-per-game scoring load. What's instructive is how different players get there. Look at the routes:
| Player | PTS | FGA | FTA | FG% | eFG% | TS% |
|---|---|---|---|---|---|---|
| Nikola Jokić | 27.7 | 17.4 | 7.4 | 56.9 | 61.8 | 67.0 |
| Shai Gilgeous-Alexander | 31.1 | 19.4 | 9.0 | 55.3 | 59.7 | 66.5 |
| Austin Reaves | 23.3 | 14.9 | 7.3 | 49.0 | 56.7 | 64.1 |
| Kevin Durant | 26.0 | 17.6 | 6.0 | 52.0 | 58.8 | 64.1 |
| Kawhi Leonard | 27.9 | 19.4 | 6.4 | 50.5 | 57.3 | 62.9 |
| Anthony Edwards | 28.8 | 20.2 | 7.2 | 48.9 | 57.2 | 61.7 |
Notice Austin Reaves and Kevin Durant landing at an identical 64.1% TS from completely different places. Durant gets there on raw shotmaking — a 52% field goal percentage that's elite for a high-volume wing. Reaves gets there at just 49% from the field, but he leans on threes (look at the gap between his FG% and eFG%) and gets to the line 7.3 times a night. Same destination, opposite maps. True Shooting is the only one of these columns that sees both routes as equally valuable, because on the scoreboard they are.
Where True Shooting still falls short
True Shooting is a better efficiency stat, not a perfect one, and it's worth being honest about the edges. It says nothing about shot difficulty: a player feasting on wide-open catch-and-shoot looks and one creating contested shots off the dribble can post the same TS%, but they are not doing the same job. It's blind to turnovers — a possession a player coughs up never shows up as a shot. And it ignores volume entirely. A reserve who takes five careful shots a game can out-TS a 30-point primary option, which tells you who's efficient but not who's carrying the offense. That's why I almost never read True Shooting alone; I read it next to usage rate, because efficiency at high volume is a fundamentally harder feat than efficiency at low volume.
It's also worth knowing the close cousin, effective field goal percentage, which makes the three-point adjustment but skips free throws. When TS% and eFG% diverge for a player, the free-throw line is the reason — and that difference is its own little scouting report.
The takeaway
If you replace one stat in your basketball vocabulary this season, make it this one. When you hear "he's shooting 45% from the field," the honest follow-up is "okay, but what's his True Shooting?" — because that's the number that actually correlates with putting points on the board. Field goal percentage tells you how often a player's shots go in. True Shooting tells you how much those shots were worth. Only one of those wins games.
Sources & Further Reading
- Background reading: Chapter 8: Shooting Efficiency Metrics, a free textbook chapter at DataField.dev.
- Player efficiency data: NBA.com/stats, pulled via the nba_api Python package (2025-26, retrieved June 2026). The script is in
scripts/true_shooting_explained.py. - Stat definitions and historical context: Basketball-Reference Glossary.
- The 0.44 free-throw coefficient and possession estimation originate with Dean Oliver, Basketball on Paper.