Usage rate is the stat people reach for when they want to say a player is "the man" — and they're right, but for the wrong reason. It doesn't measure how good a player is. It measures how much of the offense flows through his hands. Those are different questions, and conflating them is how a 20-point night on 24 shots gets mistaken for stardom.
What usage rate actually counts
Every offensive possession ends one of a few ways: someone shoots, someone gets fouled and goes to the line, or someone turns it over. Usage rate asks a simple question about a single player — of all the possessions his team used while he was on the floor, what percentage did he finish, by taking the shot, drawing the foul, or coughing up the ball? That's it. It is a share-of-the-pie number, not a quality number.
The critical word is "finished." Usage credits the player who ends the possession, not the one who created the look. The point guard who throws the perfect pocket pass picks up an assist, but the big who catches it and dunks gets the usage. So usage tilts toward shot-takers and shot-creators — the players the offense is built to feed — and it deliberately ignores whether those shots actually went in.
The formula, and what each piece is doing
The full version looks like a tax form. Don't let it scare you:
Usage RateUSG% ≈ 100 × ((FGA + 0.44 × FTA + TOV) × (Tm MP / 5)) / (MP × (Tm FGA + 0.44 × Tm FTA + Tm TOV))
Read it from the inside out. The term FGA + 0.44 × FTA + TOV is the count of possessions the player personally ended: every field goal attempt, every trip to the line (converted to possession-equivalents by that same 0.44 coefficient we use for True Shooting, because most foul trips are two shots but some aren't), and every turnover. The denominator is that same quantity for the entire team. The minutes terms — Tm MP / 5 over MP — simply scale a player's raw totals up to a full-team rate, so a starter and a bench player are compared on the same per-minute footing rather than by who logged more clock. Strip away the bookkeeping and usage rate is one fraction: the player's share of his team's possessions while he was on the court.
A league-average player sits right around 23.1% usage this season, which is exactly what you'd expect if five players split possessions evenly: one-fifth each, 20%, nudged up a touch because the data only counts rotation players. Anything in the low 30s means a player is shouldering close to a third of everything his team does on offense. That is a genuinely heavy load.
Reading the leaderboard: load is not the same as value
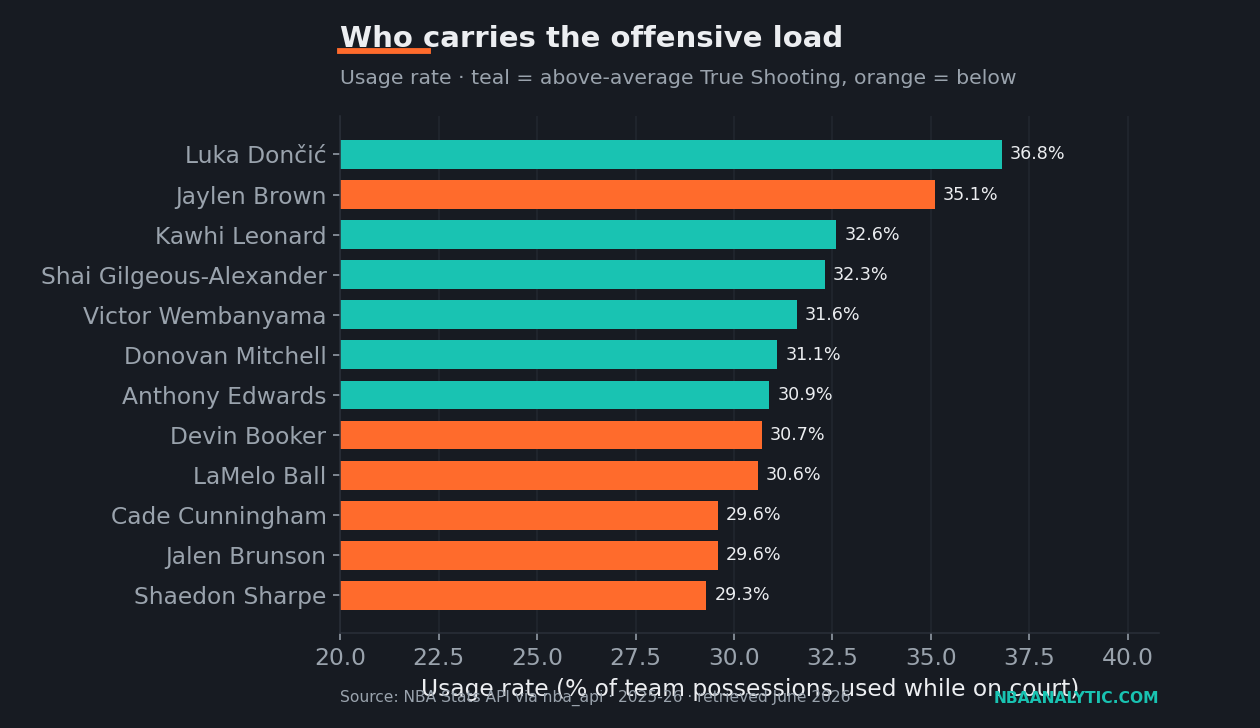
At the very top sits Luka Dončić, finishing 36.8% of Dallas's possessions — more than a third of an entire NBA offense routed through one man, on his way to a league-leading 33.5 points a night. Jaylen Brown is right behind at 35.1%, and Kawhi Leonard, Shai Gilgeous-Alexander, and Victor Wembanyama all clear 31%. These are the engines. When you watch their teams, the ball finds them by design on nearly every meaningful trip.
But here is where the chart's coloring does the real work. Usage tells you the size of the load; the teal-versus-orange split tells you whether the player is carrying it efficiently. A teal bar is a star doing the hard thing — high volume and above-average True Shooting. An orange bar is a player taking on a star's workload without a star's return on each possession. The whole point of looking at usage and efficiency together is that the bar height and the bar color are answering two completely separate questions.
| Player | USG% | TS% | PTS |
|---|---|---|---|
| Luka Dončić | 36.8 | 61.6 | 33.5 |
| Jaylen Brown | 35.1 | 57.3 | 28.7 |
| Kawhi Leonard | 32.6 | 62.9 | 27.9 |
| Shai Gilgeous-Alexander | 32.3 | 66.5 | 31.1 |
| Victor Wembanyama | 31.6 | 62.6 | 25.0 |
| Donovan Mitchell | 31.1 | 61.3 | 27.9 |
| Anthony Edwards | 30.9 | 61.7 | 28.8 |
| Devin Booker | 30.7 | 58.5 | 26.1 |
| LaMelo Ball | 30.6 | 54.6 | 20.1 |
| Cade Cunningham | 29.6 | 56.4 | 23.9 |
Scan the TS column against the 58.6% league average for qualified scorers, and the leaderboard splits into two stories. Shai Gilgeous-Alexander is the cleanest version of the dream: a 32.3% usage paired with a 66.5% True Shooting, which is to say he is carrying a primary-option load while scoring more efficiently than most role players. Kawhi Leonard and Luka pull the same trick at slightly lower efficiency but still comfortably above the line. These are teal bars — heavy usage that pays.
Then look at LaMelo Ball. He finishes 30.6% of Charlotte's possessions, a top-ten workload in the entire league, but at 54.6% True Shooting — below average. The offense runs through him as much as it runs through SGA, and returns meaningfully fewer points per possession. That is the orange bar, and it is the single most important thing usage rate can teach you: volume and efficiency are independent. A player can absolutely lead his team in usage and still be costing it points relative to a more efficient option, simply because the ball keeps finding him.
Why efficiency at high volume is the hard part
Here's the thing the leaderboard hides: efficiency and volume actively fight each other. A reserve who takes five careful shots a night can cherry-pick wide-open looks and post a gaudy True Shooting number. Ask that same player to take 22 shots, absorb the defense's full attention, and create offense when nothing is open, and his efficiency would crater. Defenses game-plan for high-usage players specifically; every possession they finish is a possession the other team knew was coming. That is why a 60% True Shooting on 36% usage is a different universe from 60% on 18% usage. The volume is the difficulty setting.
This is exactly why I never read usage rate alone, and never read efficiency alone either. Usage without efficiency flatters empty-calorie scorers — the guys who get theirs while the team treads water. Efficiency without usage flatters low-stakes role players who never have to carry anything. You need both axes to find the players who do the genuinely rare thing: stay efficient while the whole offense leans on them. Those players move the needle on team-level results, which is ultimately what offensive and defensive rating are built to measure.
The takeaway
Usage rate answers "how much?" and nothing else. It is one of the most useful stats in the box score precisely because it knows its lane — it tells you who the offense belongs to, who eats the tough possessions, who the defense has to account for first. What it will never tell you, on its own, is whether any of that is working. For that you need to pair the load with the return. So the next time someone points at a 30%-usage scorer as proof of stardom, the honest follow-up is the same one we always come back to here: "Sure, the offense runs through him. But what's his True Shooting?" High usage is a job description. Efficiency at high usage is the job done well.
Sources & Further Reading
- For the fundamentals, see Chapter 9: Advanced Box Score Metrics in DataField.dev’s free textbook library.
- Player usage and efficiency data: NBA.com/stats, pulled via the nba_api Python package (2025-26, retrieved June 2026). The script is in
scripts/usage_rate_explained.py. - Stat definitions and historical context: Basketball-Reference Glossary.
- The usage rate formulation and possession estimation originate with Dean Oliver, Basketball on Paper.