Points per game is the stat on every broadcast graphic, and it's quietly one of the most misleading numbers in basketball. A team that races up and down the floor will outscore a team that grinds out every possession, even if the slow team is the better basketball team. To compare them honestly you have to strip pace out of the equation entirely — and that's exactly what offensive and defensive ratings do.
Why points per game lies
Scoring is partly a function of skill and partly a function of opportunity. A team that plays fast simply gets more trips down the floor, so it racks up more raw points without being one ounce more efficient per possession. Compare a run-and-gun team to a deliberate, walk-it-up team and points per game tells you almost nothing about who actually plays better basketball — it mostly tells you who plays faster. Two teams can score the identical number of points per possession and finish 10 points apart in scoring average purely because of tempo. The scoreboard average can't see that, which is why I almost never start a team evaluation there.
The rating formulas
Ratings fix the pace problem by changing the denominator from "per game" to "per 100 possessions." A possession is a possession whether it lasts four seconds or twenty-four, so once you express scoring per 100 of them, the fast team and the slow team are finally on the same scale. The definitions are simple:
Offensive, Defensive & Net RatingORtg = points scored per 100 possessions · DRtg = points allowed per 100 possessions · Net = ORtg − DRtg
The only tricky part is counting possessions, since the box score doesn't hand you that number directly. The standard estimate is:
Possession estimatePossessions ≈ FGA − OREB + TOV + 0.44 × FTA
Every field goal attempt ends a possession unless it's rebounded by the offense (so we subtract offensive rebounds, which extend the same possession). Every turnover ends one too. The 0.44 coefficient converts free throw attempts into possession-equivalents — most trips to the line are two shots, but some are one-and-ones, three-shot fouls, or and-ones, and 0.44 is the league's long-run average. Divide points by possessions, multiply by 100, and you have a rating that means the same thing for the Kings and the Spurs alike.
Net Rating = Offensive Rating − Defensive Rating (per 100 possessions). Enable JavaScript to use the interactive calculator, or try our calculators page.
Reading the quadrant
The cleanest way to see a whole league at once is to plot every team's offense against its defense. One axis is ORtg, the other is DRtg, and because a low defensive rating is good, the chart is arranged so that the best teams climb toward the upper right.
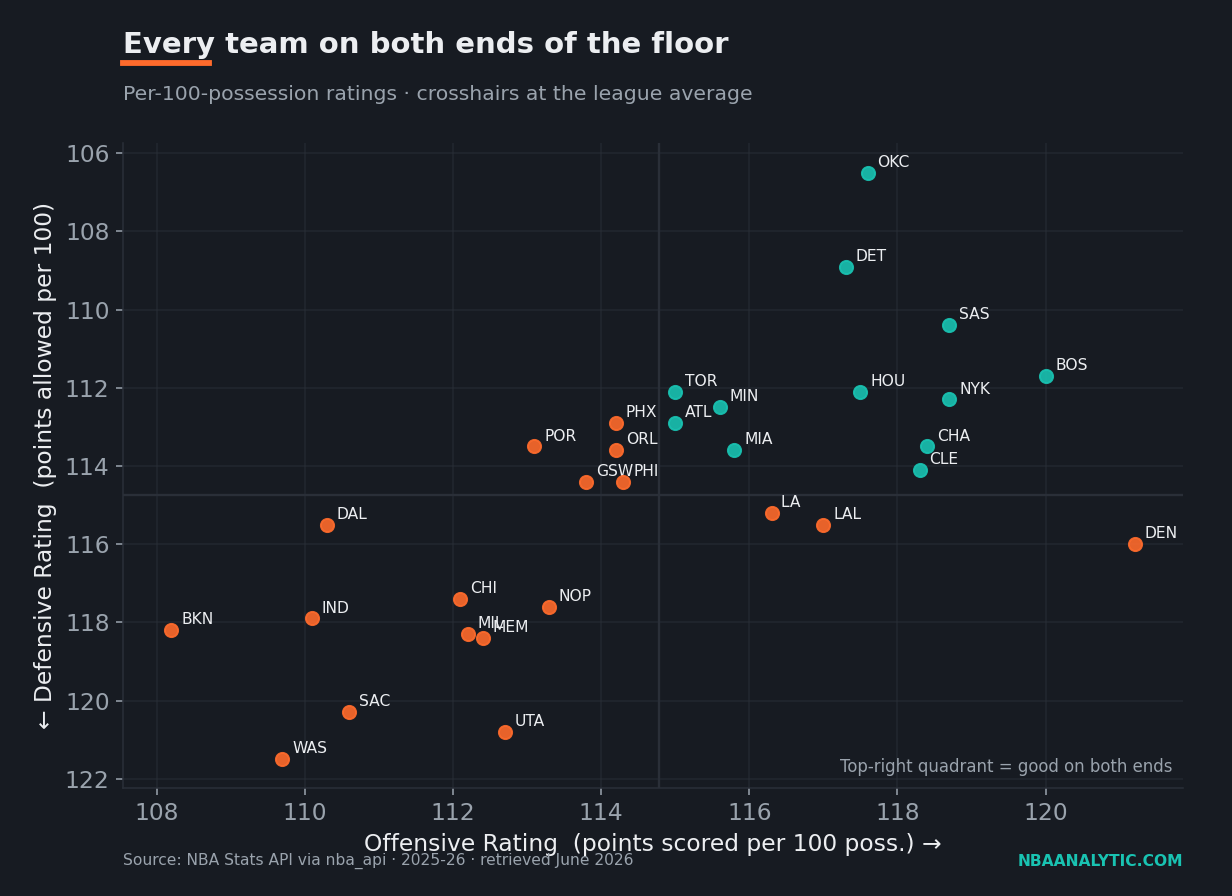
Read it by quadrant. Up-and-to-the-right is the dream: scores efficiently and defends — that's the contender corner. Down-and-to-the-left is the rebuild zone, bad on both ends. The other two corners are the one-way teams: great offense that can't get a stop, or a stingy defense that can't buy a bucket. The distance a team sits from the diagonal where offense equals defense is, visually, its net rating. The further toward the top-right corner, the wider that gap, and the better the team.
It helps to see the same picture on a full, completed season, where the quadrants have settled and there's no early-season noise. Here is the 2023-24 league, with the league-average lines drawn in and every team colored by its net rating:
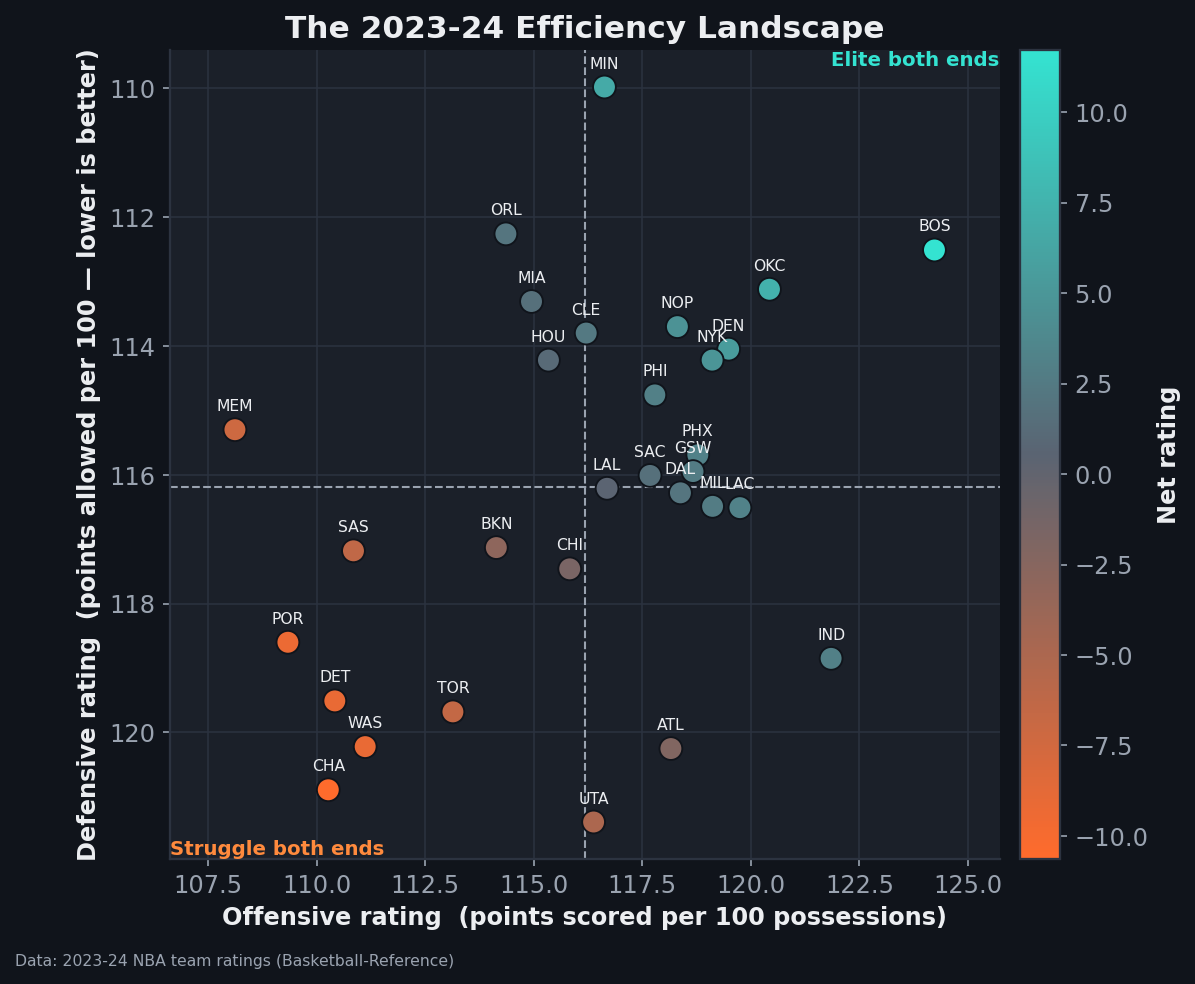
What the standings actually show
This season the league averaged 114.8 points scored per 100 possessions on offense and 114.7 allowed on defense — which is exactly as it should be, since one team's points scored are another team's points allowed, and across the whole league the two have to net out to roughly zero. That league average is your reference line: an offense above 114.8 is above-average, a defense below 114.7 is above-average, and net rating measures how far a team clears both bars at once.
At the top of the league sits Oklahoma City, and it isn't close. The Thunder pair a 117.6 offense with a 106.5 defense — better than eight points clear of the next-best defense — for a net rating of +11.1. Here are the five best and five worst teams by that single number:
| Team | ORtg | DRtg | Net |
|---|---|---|---|
| Oklahoma City Thunder | 117.6 | 106.5 | +11.1 |
| Detroit Pistons | 117.3 | 108.9 | +8.4 |
| San Antonio Spurs | 118.7 | 110.4 | +8.4 |
| Boston Celtics | 120.0 | 111.7 | +8.3 |
| New York Knicks | 118.7 | 112.3 | +6.4 |
| Indiana Pacers | 110.1 | 117.9 | −7.8 |
| Utah Jazz | 112.7 | 120.8 | −8.2 |
| Sacramento Kings | 110.6 | 120.3 | −9.7 |
| Brooklyn Nets | 108.2 | 118.2 | −10.0 |
| Washington Wizards | 109.7 | 121.5 | −11.8 |
Notice how the table sorts the contenders from the pretenders. Boston has the league's best offense at 120.0, but a merely good defense drops it to fourth in net. Oklahoma City scores less than Boston, San Antonio, and New York, yet sits comfortably first because nobody else is within shouting distance of its defense. That's the whole argument for net rating in one column: it doesn't care how you get there, only that you outscore the opponent per possession. At the bottom, Washington manages the rare feat of a below-average offense and the league's worst defense, which is how you end up at −11.8 — a near-perfect mirror image of the Thunder.
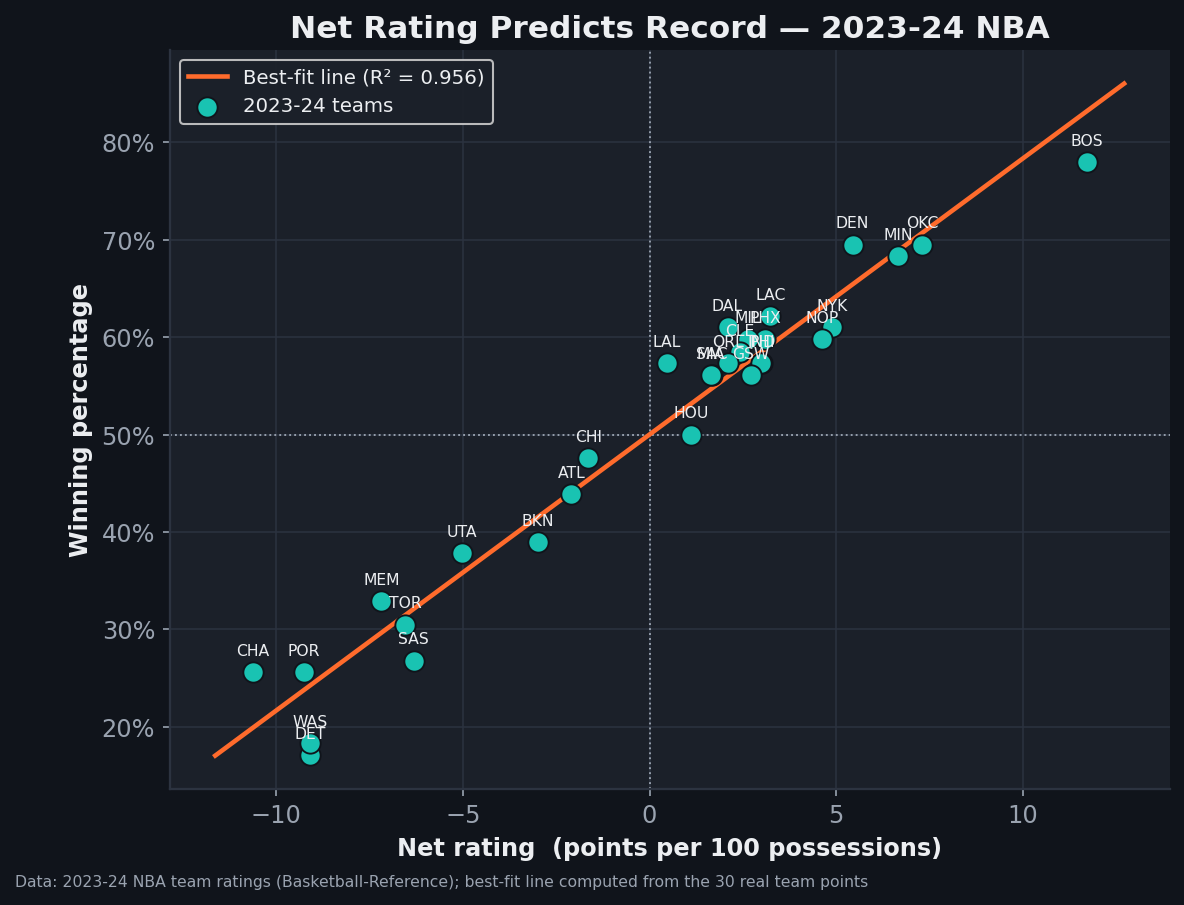
How well does that single number actually track winning? Tightly. Plot all 30 teams' net rating against their winning percentage for a completed season and the points fall almost on a straight line:
Where ratings still fall short
Net rating is the best one-number summary of team quality I know of, but it's a summary, not the whole story. It's blind to how a team builds its edge — and if you want that breakdown, the four factors (shooting, turnovers, rebounding, free throws) are where a single rating gets decomposed into its moving parts. It says nothing about which individuals drive the number, which is the gap that on-court/off-court and player-level metrics fill; team scoring is downstream of who's using the possessions, so it pays to read ratings next to usage rate. And like any per-possession rate, an early-season figure can swing on a soft or brutal schedule before the sample settles. If you want to track all of this yourself rather than take my word for it, I keep a live net rating power ranking spreadsheet that updates as the season rolls on.
The takeaway
If you upgrade one team stat in your vocabulary this season, make it this one. When you hear "they're averaging 118 points a game," the honest follow-up is "okay, but at what pace, and what are they giving up?" Points per game tells you how fast a team plays as much as how well. Net rating tells you, in a single number, whether a team is actually better than its opponents — and that's the number that tracks with banners.
Sources & Further Reading
- Free textbook: Chapter 7: Rate Statistics and Pace Adjustment — the theory behind this, at DataField.dev.
- Team rating data: NBA.com/stats, pulled via the nba_api Python package (2025-26, retrieved June 2026). The script is in
scripts/offensive_defensive_rating.py. - Stat definitions and historical context: Basketball-Reference Glossary.
- Per-100-possession ratings and the 0.44 free-throw coefficient originate with Dean Oliver, Basketball on Paper.