In 2004, Dean Oliver did something audacious: he claimed that everything a basketball team does to win a game collapses into exactly four numbers. Not forty, not four hundred — four. Shoot efficiently, hang onto the ball, rebound your misses, and get to the line. Do those four things better than the other team, on both ends, and you win. Two decades and a data revolution later, the Four Factors are still the cleanest one-page diagnosis of a team's identity that exists.
The four factors, in priority order
The genius of the framework isn't just the four numbers — it's that Oliver weighted them. They are emphatically not equal. He estimated their relative importance to winning at roughly 40 / 25 / 20 / 15, and that ranking is the whole point: shooting dwarfs everything else. Here is the full menu, formulas and all.
The Four Factors (offense)1. Shooting — eFG% = (FGM + 0.5 × FG3M) / FGA (~40%)
2. Turnovers — TOV% = TOV / (FGA + 0.44 × FTA + TOV) (~25%)
3. Offensive Rebounding — OREB% = OREB / (OREB + Opp DREB) (~20%)
4. Free-Throw Rate — FT Rate = FTA / FGA (~15%)
Every team has eight of these in total — your four on offense, and the mirror image on defense, where the goal is to suppress the opponent's four. A great defense is just a team forcing bad eFG%, generating turnovers, ending possessions on the glass, and keeping you off the line. Same four levers, opposite direction.
Four Factors: eFG% = (FGM+0.5·3PM)/FGA, TOV% = TOV/(FGA+0.44·FTA+TOV), ORB% = ORB/(ORB+Opp DRB), FT Rate = FTA/FGA — weighted 40/25/20/15. Enable JavaScript to use the interactive scorecard, or try our calculators page.
Factor one: shooting, and why it eats the others
If you only ever looked at one factor, look at this one. Effective field goal percentage is the same three-point-weighted shooting number we broke down at length in our True Shooting piece — it credits a made three as 1.5 made twos, because it is worth 1.5 made twos. At roughly 40% of the formula, eFG% carries more weight than the other three factors combined fall just short of. There is a reason every modern front office is obsessed with shot quality and shot selection: it is mathematically the highest-leverage thing on the floor.
This season the league is putting up an eFG% of 54.6% on average. That's your baseline. The offenses living above it are, with very few exceptions, the good offenses — and the team at the very top of the shooting charts is exactly who you'd expect to be efficient.
Factor two: don't give it away
A turnover is the worst outcome in basketball because it produces a shot attempt of zero points and hands the other team a possession, often in transition. Turnover percentage measures the rate per possession rather than the raw count, which is the honest way to do it — a fast team will commit more turnovers simply by having more possessions. The league average sits at 14.4%, meaning roughly one in seven possessions ends without a shot or a foul drawn. The teams that win this factor tend to be deliberate, veteran, and very hard to speed up.
Factor three: rebound your own misses
Offensive rebounding is the factor that has swung the most over basketball history. In the pace-and-space era many teams deliberately sacrifice the offensive glass to get back on defense, so the league-average OREB% has drifted down to 30.5% — about three in ten available offensive boards. That makes it the lowest-weighted of the three non-shooting factors at ~20%, but it's also where you most clearly see a coaching philosophy. A team crashing well above 30% is making a bet; a team well below it is making the opposite bet. Neither is wrong, but the number tells you which one they chose.
Factor four: get to the line
Free-throw rate — attempts at the stripe per field goal attempt — is the smallest factor at ~15%, and it does double duty. It rewards getting to the line for the free points, and it's a proxy for the kind of rim pressure and physicality that bends a defense out of shape. The league average is 26.4%, so a little better than one free throw attempt for every four shots from the floor. It's the tiebreaker factor: rarely the thing that defines a team, frequently the thing that separates two otherwise-even offenses.
Reading a team off four numbers
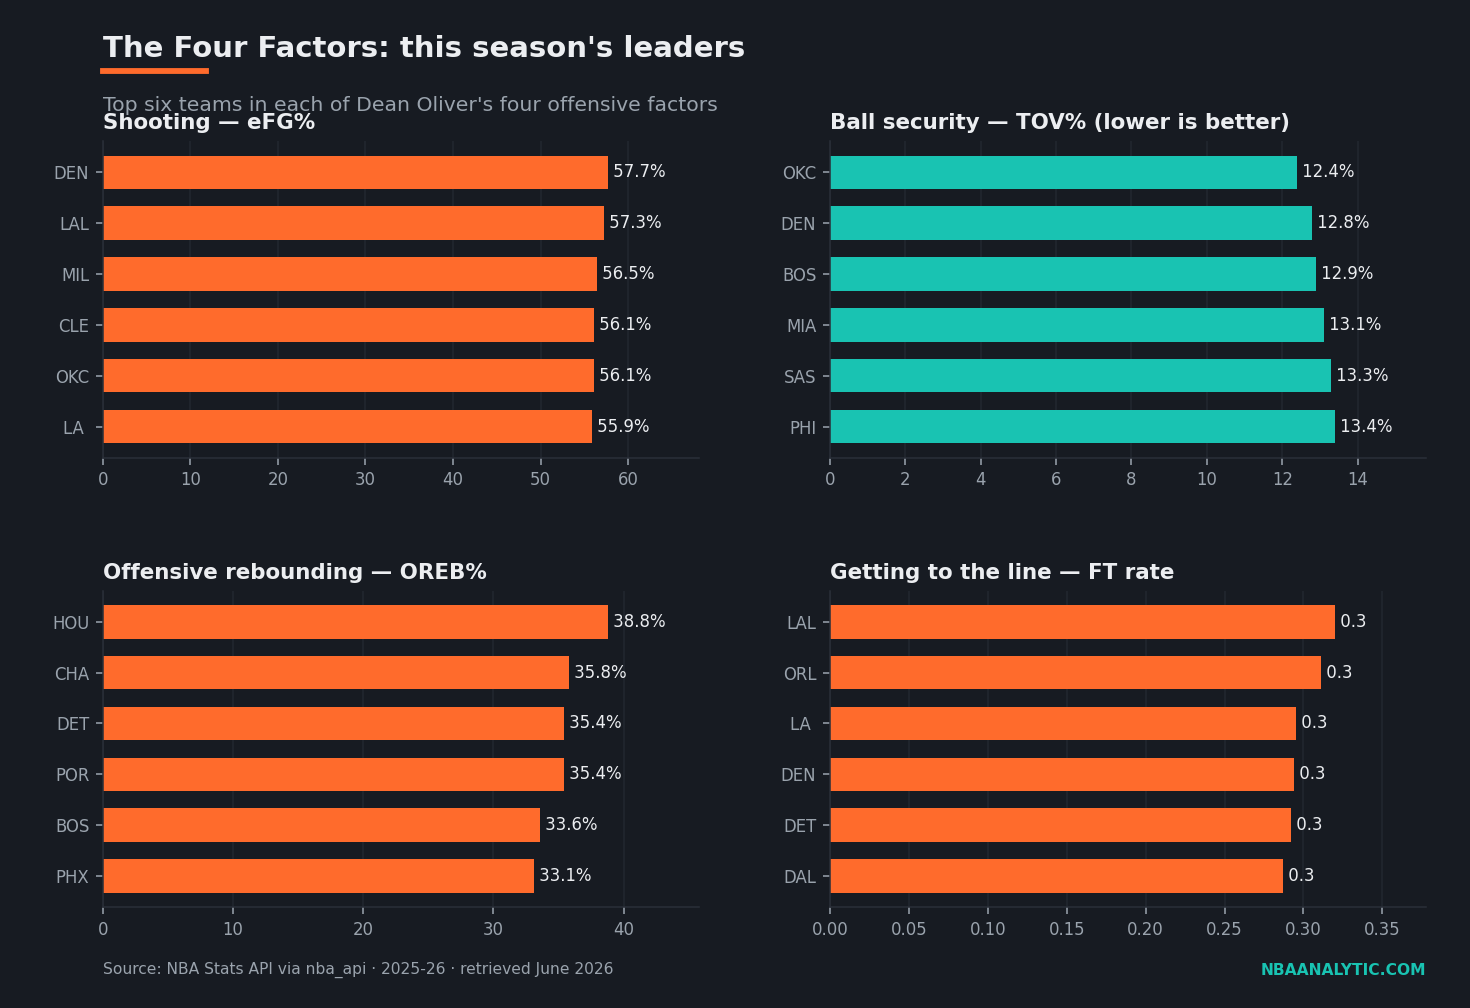
Here is the part that makes the framework worth memorizing: you can diagnose almost any team's offensive identity from its four numbers alone. Below are this season's eFG% leaders, with all four offensive factors lined up. Watch how differently teams at similar shooting marks are actually built.
| Team | eFG% | TOV% | OREB% | FT Rate |
|---|---|---|---|---|
| Denver Nuggets | 57.7 | 12.8 | 28.6 | 29.4 |
| Los Angeles Lakers | 57.3 | 14.6 | 28.5 | 32.0 |
| Milwaukee Bucks | 56.5 | 15.4 | 26.3 | 22.3 |
| Cleveland Cavaliers | 56.1 | 13.8 | 30.7 | 26.5 |
| Oklahoma City Thunder | 56.1 | 12.4 | 26.4 | 26.1 |
The Nuggets lead the league in shooting at 57.7% eFG, and they pair it with the second-lowest turnover rate in this group at 12.8% — that is a half-court machine that takes great shots and almost never wastes a possession. The Lakers shoot nearly as well and get to the line at a 32.0% clip, the highest here, telling you about a downhill, foul-drawing attack. Oklahoma City sits at the same 56.1% eFG as Cleveland, but get there as opposites on the other factors: the Thunder protect the ball best of anyone in the table at 12.4% turnovers while crashing the glass the least, where the Cavaliers are the only team above the league-average 30.5% on the offensive boards. Four numbers, four completely different blueprints — and we haven't watched a single possession.
The reason this matters beyond trivia is that the Four Factors are the bridge between the box score and the bottom line. Team efficiency — the points-per-100-possessions numbers we cover in offensive and defensive rating — is essentially the output of these four inputs. When a team's net rating swings, it's because one or more of these eight factors moved. The factors are the why underneath the what.
The takeaway
Oliver compressed winning basketball into four levers and then told you which ones to pull hardest: shoot well first, protect the ball second, rebound your misses third, get to the line fourth — and do all of it on defense too. Twenty years later, with infinitely more data than he had, the hierarchy hasn't budged. Shooting is still king by a wide margin, and the other three factors are how you scratch out the margins around it. The next time you want to understand a team in thirty seconds, skip the standings and pull its eight factors. They'll tell you not just how good a team is, but exactly what kind of good it is.
Sources & Further Reading
- Background reading: Chapter 7: Rate Statistics and Pace Adjustment, a free textbook chapter at DataField.dev.
- Team factor data: NBA.com/stats, pulled via the nba_api Python package (2025-26, retrieved June 2026). The script is in
scripts/four_factors.py. - The Four Factors framework, their weights, and possession estimation originate with Dean Oliver, Basketball on Paper.
- Stat definitions and historical context: Basketball-Reference Glossary.