Here is a fact that sounds like a paradox and isn't. In 2023-24, NBA players shot a worse percentage from 23 feet than from 20 feet — and the 23-footer was still the far better shot. We binned 25,000 real shots by their exact distance and watched two curves diverge: accuracy falls smoothly and relentlessly as you back up from the rim, but the value of a shot falls with it right up until the three-point line, where it jumps off a cliff in the good direction. That discontinuity is the single most important line in modern basketball, and you can see it in the raw make rates.
The smooth part: accuracy just decays
Shooting a basketball gets monotonically harder the farther you stand from the hoop. No surprise there, but it is worth seeing how orderly the decline is. We bucketed every non-backcourt shot in the bundled shot file by distance and took the make rate in each band. It is almost a clean staircase down.
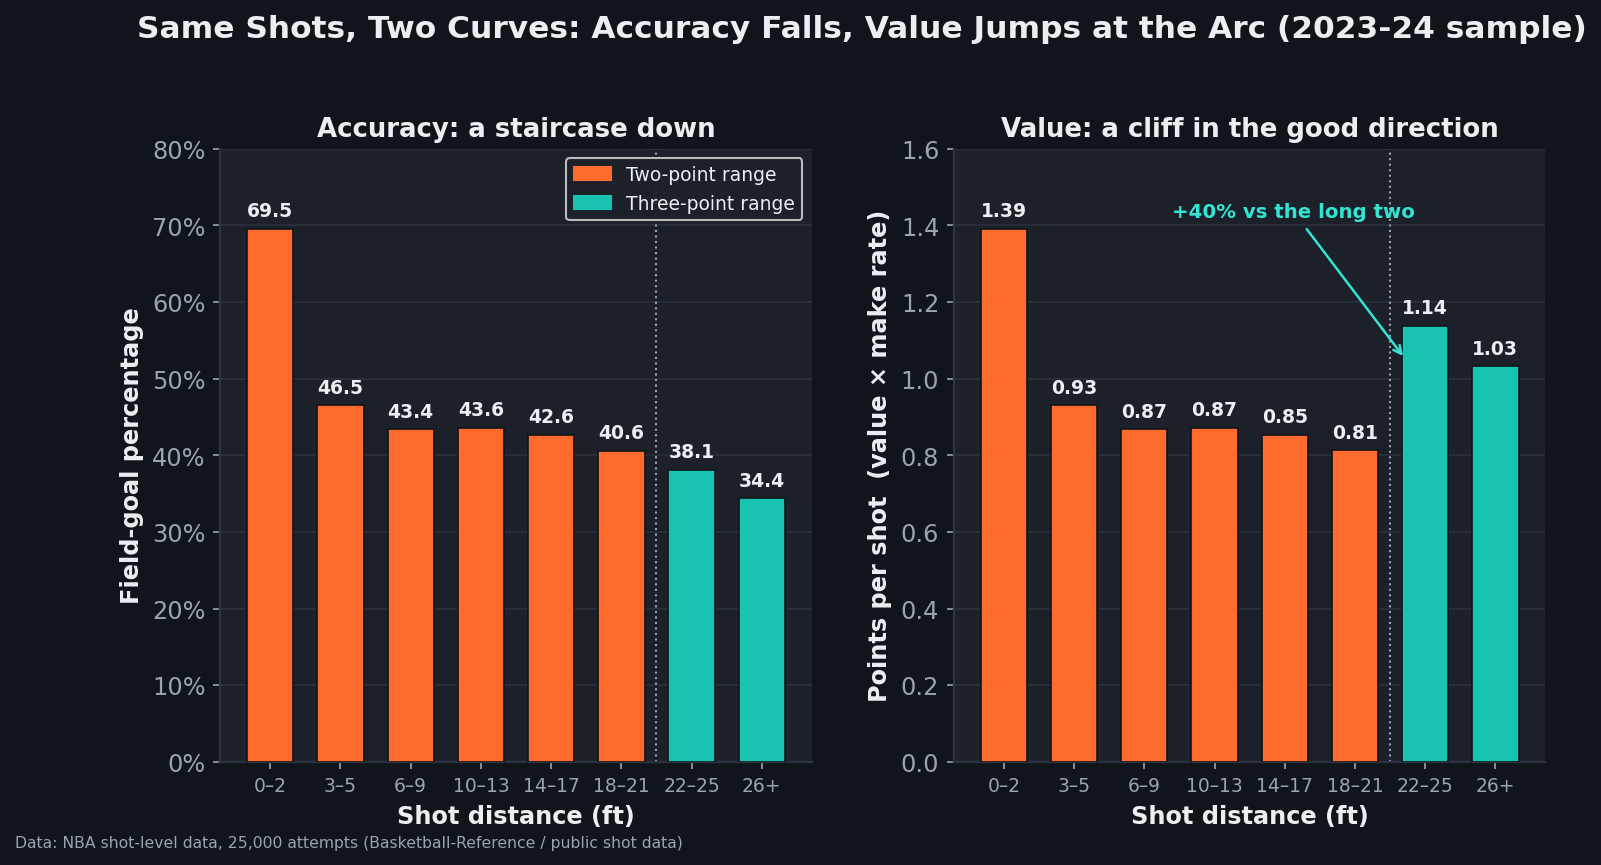
data_layer/nba_league_shots.csv (25,000 attempts; Basketball-Reference / public shot data), backcourt heaves excluded. Charted by chart_accuracy_value_by_distance.py with a stamped provenance footer.| Distance | Attempts | FG% | Points per shot | Share of all shots |
|---|---|---|---|---|
| 0–2 ft (at the rim) | 5,952 | 69.5% | 1.39 | 23.9% |
| 3–5 ft | 3,134 | 46.5% | 0.93 | 12.6% |
| 6–9 ft | 2,245 | 43.4% | 0.87 | 9.0% |
| 10–13 ft | 1,717 | 43.6% | 0.87 | 6.9% |
| 14–17 ft | 1,299 | 42.6% | 0.85 | 5.2% |
| 18–21 ft | 690 | 40.6% | 0.81 | 2.8% |
| 22–25 ft | 6,190 | 38.1% | 1.14 | 24.8% |
| 26+ ft | 3,720 | 34.4% | 1.03 | 14.9% |
Source: bundled data_layer/nba_league_shots.csv, 25,000 shot-level records (Basketball-Reference / public NBA shot data), backcourt heaves excluded. FG% and points per shot computed by binning SHOT_DISTANCE; points per shot = shot value (2 or 3) × make rate. Two- vs three-point value assigned from SHOT_TYPE.
Read the FG% column top to bottom and it never once goes back up: 69.5, 46.5, 43.4, 43.6, 42.6, 40.6, 38.1, 34.4. The two 22-to-25 and 26-plus bands, which are three-point range, keep obeying the rule — a 26-footer is harder than a 23-footer and the make rate says so. Accuracy is a pure function of distance, and nothing about crossing the arc changes that. If points were all that mattered, every shot would be a layup.
The cliff: value doesn't
Now read the points-per-shot column instead, and the smooth staircase breaks. Value falls in lockstep with accuracy through the entire two-point range — 1.39 at the rim, down through 0.93, 0.87, 0.85, bottoming at 0.81 in the 18-to-21-foot band, the long two, the worst-paying real estate on the floor. And then, at exactly the point where the accuracy staircase keeps descending, the value line leaps: the 22-to-25-foot band pays 1.14 despite a make rate of only 38.1%.
That is the cliff. A shot from 20 feet returns 0.81 points; a shot from 23 feet returns 1.14 — a 40% jump in value for backing up three feet and shooting a lower percentage. Nothing about the shooter's skill changed across those three feet. The only thing that changed is that the scorekeeper started awarding three points instead of two. The entire modern reshaping of NBA offense is a response to this one discontinuity, and it is why we keep coming back to the arithmetic in points per shot.
Worked example: the 20-footer versus the 23-footer
Put the two shots side by side and do the multiplication by hand, because the whole lesson fits in two lines. Points per shot is nothing more than the point value times how often the shot goes in.
The long two, from the data: a two-point shot hitting 40.6% of the time is worth 2 × 0.406 = 0.81 points per attempt. The above-the-break three: a three-point shot hitting 38.1% is worth 3 × 0.381 = 1.14 points per attempt. The three-pointer is made two-and-a-half percentage points less often, and it still pays 40% more. A player who shoots 41% on long twos and 38% on threes should never take the long two — the extra point swamps the accuracy gap and then some. Multiply that edge across a season of attempts and you have the reason the 18-to-21-foot band is down to 2.8% of all shots while the 22-to-25 band is up at 24.8%. Teams didn't abandon the long two because they forgot how to shoot it. They abandoned it because 0.81 sits below 1.14, and there is a bright painted line that makes the difference legal.
Why the rim still wins
The cliff at the arc gets the attention, but the tallest number in the table is at the other end: 1.39 points per shot from inside three feet, on a 69.5% make rate. The rim wins not because the reward is large — it is only two points — but because the success rate is enormous, and no amount of three-point value catches a shot that goes in seven times out of ten. This is why the modern floor has two peaks and a starved middle, the exact distribution we mapped in where the NBA actually shoots from. The layup and the open three are the whole menu; everything between 4 and 21 feet is the food nobody orders. The corner three, which sits a foot closer than the top of the arc, is just the sweetest version of the same trade.
Honest limitations
Distance is not difficulty. The bins treat every 18-footer as the same shot, but a wide-open catch-and-shoot 18-footer and a fadeaway 18-footer over a contest are worlds apart. FG% by distance folds shot quality, defender proximity, and shot type into one average. That is exactly the gap that shot-quality tracking exists to fill, and it means the value cliff describes the average shot, not any particular one.
The metric ignores fouls entirely. Points per shot counts only attempts that end in a field-goal try. A drive to the rim that draws a shooting foul scores zero in this table even though it might net a point and a half from the line. That undercounts rim pressure specifically, and it is the reason true shooting percentage folds free throws back in. The rim's 1.39 is, if anything, an understatement of its real value.
Selection runs both ways at the rim. That 69.5% make rate is partly a product of shot selection, not just proximity — the rim attempts that survive into the data are the ones players chose to take after passing up the contested drives. Read it as the payoff of good rim shots, not proof that any drive is a good idea.
Late-clock situations flip the math. When a possession is dying and the defense has taken away the rim and the arc, the devalued mid-range jumper is suddenly the correct read, because a 0.81 shot beats a 0.0 turnover. That is the whole nuance of the mid-range's evolution: the shot is inefficient on average and indispensable in context.
The takeaway
Two curves, one floor. Accuracy falls smoothly and honestly with every foot you back away from the rim, and it never lies — a 23-footer really is harder than a 20-footer. But value does not follow accuracy across the three-point line; it falls off a cliff in the good direction, because the rulebook pays a full extra point for a shot that is only a little harder. Run your own numbers on the Shot-Value Explorer and you can watch it happen: crank the long-two make rate up to something no one shoots and it still can't catch an ordinary three. The modern NBA is just a league that read this table and started standing on the far side of the line.
Sources & Further Reading
- Shot-level data: bundled
data_layer/nba_league_shots.csv(25,000 attempts; Basketball-Reference / public NBA shot data). FG% and points per shot by distance computed with a pandas cut onSHOT_DISTANCE. - The geography of shot selection and the death of the long two: Kirk Goldsberry, Sprawlball.
- Expected-value framing of shooting: Dean Oliver, Basketball on Paper.
- Shot-zone make rates and stat definitions: Basketball-Reference Glossary; live shot data at NBA.com/stats.
- Three-point line geometry and court dimensions: official NBA Rulebook.