I pulled 25,000 real NBA shots, dropped every one onto the floor by zone, and counted. The picture that came back isn't subtle: roughly seven of every ten attempts now come from exactly two places — right at the rim or from behind the three-point line. The mid-range, the jump shot that defined the sport for half a century, has been reduced to about one shot in nine. This is the modern shot chart, and the league didn't hollow out the middle of the floor by accident. It did the arithmetic.
The finding, in one number
Here is the headline straight off the data. Of the 25,000 shots in this sample, 29.5% came from the restricted area — the little half-circle under the basket — and 39.5% were three-pointers. Add those together and 69% of every field-goal attempt in the league comes from the rim or the arc. The mid-range, by contrast, accounts for just 11.1%. The geometry of NBA offense has collapsed toward its two endpoints and abandoned the territory in between.
This is the data companion to my conceptual piece on points per shot and shot selection. There I argued, from the formula, why the floor should look like this. Here I'm showing you that it actually does, with the real distribution, and putting numbers on every zone so you can check the argument against the evidence rather than taking my word for it.
The exhibit
One chart carries the whole story. The bars are the share of all attempts taken from each zone; the line read against the right axis is the points per shot that zone returns — its point value times how often the shot actually went in, averaged over every make and miss in the sample.
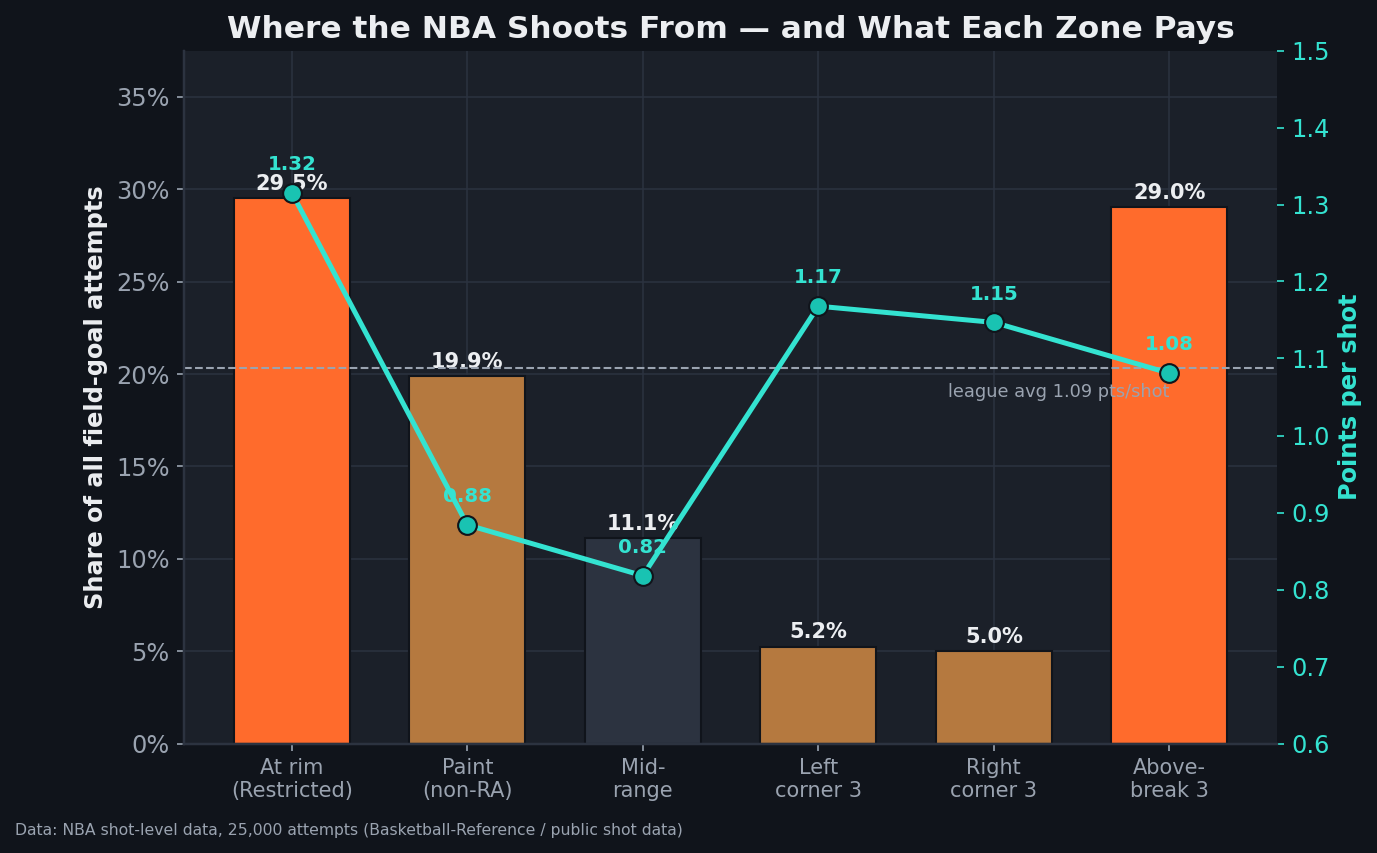
nba_league_shots.csv via a pandas groupby on BASIC_ZONE; chart generated by the site's charts pipeline with a stamped provenance footer.Look at the shape. The bars and the line tell the same story from two directions: attempts cluster where the points per shot is high. The rim is the tallest payoff and one of the two tallest bars. The above-the-break three is the other skyscraper bar, sitting right at the league-average payoff. And the mid-range — the lowest point on the entire points-per-shot line — is a stub. Teams aren't shooting from the valley; they're shooting from the two peaks.
The full distribution
Here is every zone, straight from the groupby, so nothing is hidden behind the chart:
| Zone | Share of shots | FG% | Points per shot |
|---|---|---|---|
| Restricted area (at the rim) | 29.5% | 65.8% | 1.32 |
| Above-the-break three | 29.0% | 36.0% | 1.08 |
| Paint, non-restricted (floaters) | 19.9% | 44.2% | 0.88 |
| Mid-range | 11.1% | 40.9% | 0.82 |
| Left corner three | 5.2% | 38.9% | 1.17 |
| Right corner three | 5.0% | 38.2% | 1.15 |
And if you bucket the same shots by raw distance instead of by named zone, the pattern survives intact. The two extreme bands swallow the floor: 29.5% of attempts come from inside three feet (at 65.8%, worth 1.32 a shot) and 39.9% from 22 feet and out (the three-point band, 1.09 a shot). The dead zone is everything in between — the 16-to-21-foot band, the classic long two, draws just 5.2% of all attempts and pays a miserable 0.83. The shape of the distance histogram is a U: two fat tails and a starved middle.
Worked example: why the corner beats the elbow
Take two real shots from the table and run the points-per-shot math by hand, because this is where the abstract finding turns concrete. Points per shot is the point value of the shot multiplied by the rate it goes in — that's the entire calculation.
The mid-range, at the make rate this sample actually produced: a two-pointer hitting 40.9% of the time is worth 2 × 0.409 = 0.82 points per shot. Now the left corner three: a three-pointer at 38.9% is worth 3 × 0.389 = 1.17 points per shot. Same difficulty of release, roughly — both are catch-and-shoot jumpers a good pro hits at a similar clip — but the corner three pays 43% more per attempt purely because each make is worth an extra point. That single-point bonus, not any difference in shooting touch, is the whole edge. A team that swaps 100 mid-range jumpers for 100 corner threes gains roughly 35 points across those shots without anyone improving as a shooter. Multiply that across a season of attempts and you've explained why the elbow jumper got swung out to the corner.
The rim is the other peak, and it's even starker: a 65.8% make rate on a two is worth 1.32 a shot, the best deal on the floor by a wide margin. The rim pays not because the reward is big — it's only two points — but because the success rate is enormous. The whole modern offense is a machine for manufacturing those two shots, the layup and the open three, and skipping everything in between.
Try it yourself
If you want to feel the trade-off rather than read it, the Shot-Value Explorer lets you set a team's shot mix across the zones and its make rate in each, then watch the total expected points per 100 shots move. Drag the mid-range make rate up to an unrealistic 48% and notice it still barely catches an average corner three. The corner's extra point is doing work that better shooting can't easily overcome from two-point range — which is exactly the lesson the real distribution above is built on.
Reproducibility
Every number here is one groupby over the bundled shot file. Nothing was hand-entered. This is the exact computation behind the chart and the table:
import pandas as pd

df = pd.read_csv("data_layer/nba_league_shots.csv")
df["made"]   = df["SHOT_MADE"].astype(bool)
df["value"]  = df["SHOT_TYPE"].str.startswith("3").map({True: 3, False: 2})
df["points"] = df["value"] * df["made"]

n = len(df)
by_zone = df.groupby("BASIC_ZONE").agg(
    share=("made", lambda s: 100 * len(s) / n),
    fg_pct=("made", "mean"),
    pps=("points", "mean"),
)
print(by_zone)
Run it against the CSV that ships in this site's data_layer/ and you'll reproduce the restricted-area 1.32, the mid-range 0.82, and the 69% rim-plus-three share to the decimal.
Honest limitations
I'd be a hypocrite to lead with a single clean number and not fence it in. Several things this analysis cannot see.
It's one sample, one slice of seasons. Twenty-five thousand shots is a healthy sample, but it's not every shot ever taken, and shot mix has drifted year over year — the three-point share I show here is higher than it was a decade ago and will likely be higher still in a few more. Read the percentages as a snapshot of the modern game, not an eternal constant.
There's no shot quality and no defender. The data records where the shot came from and whether it fell, full stop. It says nothing about whether a defender was draped over the shooter or whether the look was wide open. An open mid-range and a contested one carry the same 0.82 in this table, which is plainly wrong as a guide to a single possession — that's the whole subject of shot quality tracking. Late in the clock against a switch that's taken everything better away, that mid-range jumper is the correct read, as I argue in the mid-range's evolution.
Selection effects run both ways. The rim's 65.8% looks like proof that everyone should drive every time, but teams already hunt the easy ones — the rim attempts that survive into the data are disproportionately the good ones, after the bad drives got passed up or stripped. The make rate is partly a product of the very selection it appears to justify. Points per shot also counts only shots that end in a field-goal attempt; a drive that draws a foul scores zero by this metric even though it might net 1.5 from the line, which undersells rim pressure. That gap is what True Shooting percentage exists to close.
League-wide hides team variation. Averaging all 30 teams into one distribution erases the spread. Some teams shoot threes at nearly half their attempts; others, built around a dominant mid-range scorer, still live in the zones this chart calls dead — and win doing it. The aggregate tells you where the league's center of gravity sits; it does not tell you that every team should stand on that spot. Variance matters too: a three-heavy diet pays more on average but swings harder game to game, the subject of three-point variance.
The takeaway
Drop 25,000 real shots onto the floor and the modern NBA draws its own self-portrait: two crowded peaks at the rim and the arc, a starved valley in between, and a points-per-shot line that explains exactly why. The mid-range didn't die because shooters forgot how to make it. It thinned out because 0.82 sits below 1.08 sits below 1.32, and a league that took that arithmetic seriously rebuilt its floor around the difference. The corner three at 1.17 and the layup at 1.32 are the shots the whole machine is built to manufacture. Everything you see when a team passes up an open elbow jumper to swing the ball to the corner is this distribution, enforced one possession at a time.
Sources & Further Reading
- Theory: Chapter 16: Shot Quality Models — a free chapter at DataField.dev.
- Shot-level data and zone definitions: bundled
data_layer/nba_league_shots.csv(Basketball-Reference / public NBA shot data), 25,000 attempts; live equivalents at NBA.com/stats and PBP Stats. - The geography of modern shot selection and the death of the long two: Kirk Goldsberry, Sprawlball: A Visual Tour of the New Era of the NBA.
- Points-per-possession and expected-value framing of shot selection: Dean Oliver, Basketball on Paper.
- Stat definitions and shot-zone make rates: Basketball-Reference Glossary.
- Three-point line geometry and court dimensions: official NBA Rulebook.