The New Orleans Pelicans won 49 games in 2023-24 and exactly one of them — February 2 in San Antonio, 114-113 — was decided by three points or fewer. The Lakers also won in the forties (47), yet eleven of theirs were one-score finishes, the most in the league. At the top of the standings, Boston assembled the best record in basketball substantially out of routs: 30 of its 64 wins came by 15 or more. At the bottom, Charlotte won 21 times and managed exactly one blowout all season. Same win column, wildly different contents — so I classified every one of the season's 1,230 regular-season results by margin and asked whether the shape of a team's win column tells you anything its record doesn't. It does: hold the record fixed and blowout-win share still correlates with net rating at a partial r of +0.71, and two style numbers recover about 53% of the quality signal the W-L record throws away. The catch is what that signal means. It isn't that grinders “know how to win” — it's usually that their records are writing checks their scoring margin can't cash.
What counts as what
The bookkeeping first. The bundled game log has 1,231 rows; one of them — the December 9 In-Season Tournament final, Pacers at Lakers — is not a regular-season game and gets dropped, leaving 1,230 games that put all 30 teams at exactly 82. (The replayed win totals match the bundled ratings file for all 30 teams; that audit runs inside the chart script on every build.) Every win then lands in one of three bands by final margin: a blowout win (15 or more), a mid win (4–14), or a one-score win (1–3 — one possession). League-wide, the 1,230 games split 399 blowouts (32.4%), 660 mids (53.7%), and 171 one-score finishes (13.9%) — the blowout-heavy shape I mapped in how often is an NBA game actually close, which works from all 1,231 rows; the one-row difference doesn't move those percentages at this precision.
The average team's wins split 30.4% blowout, 54.3% mid, 15.2% one-score. The spread around that average is the article.
The blowout artists
| Team | Record | Wins by 15+ | Share of wins | Net rating |
|---|---|---|---|---|
| Boston | 64-18 | 30 | 46.9% | +11.71 |
| New York | 50-32 | 21 | 42.0% | +4.89 |
| Minnesota | 56-26 | 23 | 41.1% | +6.65 |
| Orlando | 47-35 | 19 | 40.4% | +2.10 |
| Indiana | 47-35 | 19 | 40.4% | +2.99 |
| Oklahoma City | 57-25 | 23 | 40.4% | +7.31 |
Boston is the caricature made real: nearly half its wins were 15-point routs, and 19 of the 30 were by 20-plus. But the strangest style profile in the league belongs to New Orleans — 19 blowout wins against that single one-score win. The Pelicans went 1-7 in one-possession games while out-blowing-out all but six teams; their 49-33 record was built almost entirely in games that were never in doubt.
The other end of the list is bleak in a different way. Charlotte's lone blowout win was February 14 against Atlanta, 122-99. Memphis managed two all season (January 9 in Dallas, April 5 over Detroit) — a 7.4% blowout share. Washington (3), Portland (4), and Chicago (7) round out the bottom five. Among teams that finished over .500, Miami had the thinnest blowout diet: 10 of 46 wins, 21.7%.
The grinders
| Team | Record | Wins by 1–3 | Share of wins | Net rating |
|---|---|---|---|---|
| Charlotte | 21-61 | 7 | 33.3% | −10.63 |
| Washington | 15-67 | 4 | 26.7% | −9.10 |
| Atlanta | 36-46 | 9 | 25.0% | −2.09 |
| Portland | 21-61 | 5 | 23.8% | −9.26 |
| L.A. Lakers | 47-35 | 11 | 23.4% | +0.47 |
Notice who populates this table: four of the five are bad teams, and the Lakers are the only one with a winning record. That's not a coincidence, and it's the first honest thing to say about win style: it is mostly a quality readout. Blowout-win share correlates with winning percentage at r = +0.66 (95% CI roughly 0.39 to 0.82 at n=30), one-score share at −0.59. To win by 15 you generally have to be much better than the other team that night; teams that are rarely much better than anyone collect their wins in coin-flip territory because that's the only territory available to them. Detroit is the exception that proves it — even the 14-win Pistons took 4 of their 14 by blowout, a higher share than Miami — and their lone one-score win (December 30 over Toronto, 129-127) came in a season where they went 1-7 in one-possession games.
Same record, different team
If style were only a quality readout, it would be redundant with the record. It isn't. The 2023-24 standings handed out several identical records, and inside almost every cluster the team that won bigger was genuinely stronger:
| Record | Team | Wins by 15+ / by 1–3 | Net rating |
|---|---|---|---|
| 57-25 | Oklahoma City | 23 / 6 | +7.31 |
| Denver | 18 / 6 | +5.44 | |
| 50-32 | New York | 21 / 4 | +4.89 |
| Dallas | 17 / 5 | +2.09 | |
| 49-33 | New Orleans | 19 / 1 | +4.61 |
| Phoenix | 15 / 8 | +3.09 | |
| Milwaukee | 15 / 4 | +2.64 | |
| 47-35 | Philadelphia | 16 / 3 | +3.02 |
| Indiana | 19 / 6 | +2.99 | |
| Orlando | 19 / 6 | +2.10 | |
| L.A. Lakers | 13 / 11 | +0.47 | |
| 21-61 | Portland | 4 / 5 | −9.26 |
| Charlotte | 1 / 7 | −10.63 |
Oklahoma City and Denver both went 57-25; the Thunder banked five more blowout wins and finished 1.87 points of net rating ahead. New York and Dallas both went 50-32; the Knicks' 42% blowout share came with a rating 2.8 points better. The 47-win quartet is the whole argument in one row of the standings: Philadelphia, Indiana, Orlando, and the Lakers finished with identical records, and the gap between the grindiest of them (the Lakers, 11 one-score wins) and the rest was 1.6 to 2.6 points of net rating — roughly four to six wins of underlying quality hiding behind the same 47-35.
The formal version. Regress net rating on winning percentage across the 30 teams and the record explains a lot — R² = 0.956, leftover spread 1.21 points — but the leftover is not noise: it correlates with blowout-win share at r = +0.54. Hold the record fixed entirely and the partial correlation between blowout share and net rating is +0.71 (95% CI 0.47 to 0.86); for one-score share it's −0.49 (CI −0.73 to −0.16). Add both style shares to the regression and R² climbs to 0.979 — the two composition numbers recover 52.8% of the variance the record leaves unexplained, and the leftover spread shrinks from 1.21 to 0.86 points. Style isn't a law inside every cluster — Phoenix out-rated Milwaukee at 49-33 despite the same blowout count and twice the one-score wins — but across 30 teams the tilt is unmistakable.
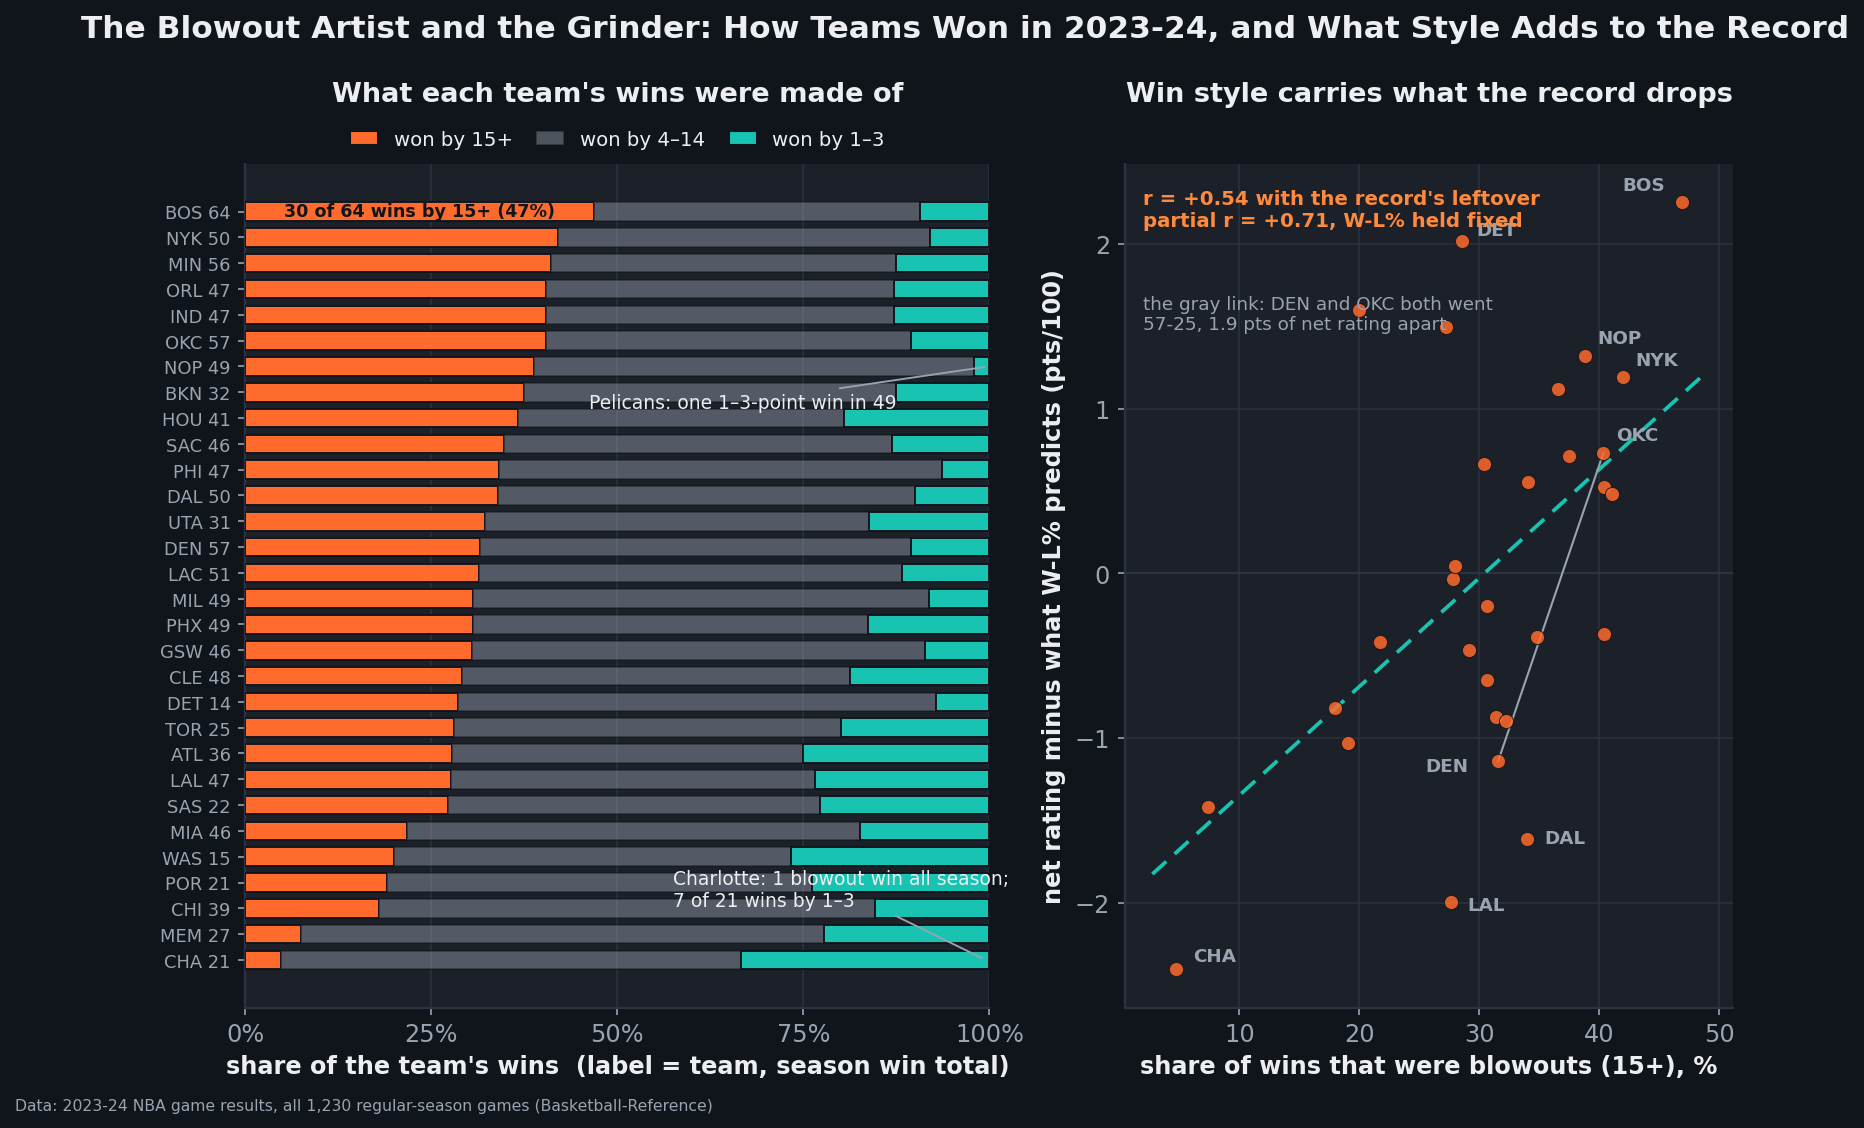
data_layer/nba_home_results.csv — 1,231 rows, with the 2023-12-09 In-Season Tournament final excluded as non-regular-season, leaving 1,230 games — audited against data_layer/nba_ratings.csv. Chart by chart_win_styles.py.Why style knows things the record doesn't
None of this is mysterious, and I'd rather deflate the finding correctly than sell it as psychology. A W-L record is a brutal compression: it takes every final margin — a 2-point escape, a 30-piece — and bins it to ±1. Net rating is scoring margin, per 100 possessions. Win-style shares are a coarse un-binning: knowing a win was a blowout tells you it banked at least five times the margin of a one-score win. So of course composition recovers rating information — it's smuggling the margins back in. That's precisely why net rating tracks the standings tighter than records track each other year to year, and it's why the scatter's vertical axis is, near enough, Pythagorean luck with the sign flipped: Detroit's record sat about six wins below its scoring margin, and there the Pistons are at +2.0, the second-most-undersold team in the league after Boston (+2.25), whose 64-18 still managed to flatter its opponents.
The grinder's flattered record
Now the other half of the thesis: what a grinder profile actually predicts. One-score share of wins by itself is a weak luck detector — it correlates with Pythagorean over-performance at only r = +0.23, because a team can also lose a pile of one-score games and cancel the signal. The luck lives in the close-game record: wins-above-Pythagorean expectation correlates with net one-score record (wins minus losses) at r = +0.52 and with one-score winning percentage at +0.58.
Put names on it. The Lakers went 11-4 in one-possession games and finished +4.6 wins above their Pythagorean expectation, the league's largest overshoot; Dallas (5-2 in one-score games) ran +3.6; Memphis (6-3) and Charlotte (7-3) each banked about +3.1. On the other side, Detroit went 1-7 in one-possession games and landed −6.4 — by scoring margin a 20-win team that finished with 14 — while Golden State went 4-11 in one-score games and New Orleans 1-7. (My Pythagorean numbers here use the 1,230-game log, so every team sits on 82; the site's Pythag piece includes the IST final row and lands on the same ±4.6 and −6.4 after rounding.)
The reason I call this flattering rather than clutch: close-game winning percentage is nearly unrelated to how good a team is. Across the 30 teams it correlates with overall winning percentage at just +0.27 and with net rating at +0.15, and the league-average close-game win rate is 0.498 — a coin, as the luck piece keeps finding from other directions. A team whose record was built in one-score games hasn't demonstrated a repeatable skill; it has demonstrated that the coin came up its way, and coins don't remember. Boston, for what it's worth, went 6-7 in one-possession games — the best team of the season was under .500 in the coin flips and it did not matter, because Boston rarely let games get there.
Honest caveats at n=30
- The thresholds are conventions. 15+ for a blowout and 1–3 for one-score are the site's standing definitions, not laws. Redefine a blowout as 10+ and the partial correlation with net rating is +0.69; as 20+, it's +0.57; widen one-score to 1–5 and the variance recovered moves to 54%. The result survives the knife, but the exact numbers wobble.
- Thirty teams is thirty data points. The confidence intervals above are honest and wide — the partial correlation's CI spans 0.47 to 0.86 — and I examined several correlations to write this, which is how flattering ones get found. Treat the effect as robust, the third decimal as decoration.
- Small denominators at the extremes. Charlotte's 33% one-score share is 7 games out of 21 wins; Detroit's entire style profile rests on 14 wins. Shares built on basement win totals swing hard on single games.
- This is descriptive, not a forecast test. Style, record, and rating all come from the same 82 games; a real predictive claim — that style in the first half foretells the second half better than the record does — needs a split this article doesn't perform. The mechanism (margin information) is the same one that makes rating-based projections work, but I haven't proven the forward version here.
- Final margins undercount true blowouts. Garbage-time bench runs routinely trim 20-point games to 14 by the buzzer, so the blowout counts here are conservative — garbage-time distortion covers how much. Rest, injuries, and schedule spots are also invisible to a five-column game log.
Reproduce it
One pass over the log, one merge, one regression.
import numpy as np
import pandas as pd

g = pd.read_csv("data_layer/nba_home_results.csv")
g = g[~((g.date == "2023-12-09") & (g.away_team == "Indiana Pacers")
        & (g.home_team == "Los Angeles Lakers"))]   # IST final: not reg. season
m = g.home_pts - g.away_pts                           # 1,230 games remain
g["winner"] = np.where(m > 0, g.home_team, g.away_team)
g["am"] = m.abs()

rows = []
for t, won in g.groupby("winner"):                    # every team won at least 14
    rows.append(dict(team=t, W=len(won),
                     bw_sh=(won.am >= 15).mean(),     # blowout share of wins
                     ow_sh=(won.am <= 3).mean()))     # one-score share of wins
d = pd.DataFrame(rows)

r = pd.read_csv("data_layer/nba_ratings.csv")         # audit W, take NRtg
d = d.merge(r, left_on="team", right_on="Team")
assert (d.W_x == d.W_y).all()                         # replayed wins match
d["wpct"] = d.W_x / 82

b, a = np.polyfit(d.wpct, d.NRtg, 1)                  # the rating the record implies
resid = d.NRtg - (a + b * d.wpct)
print(round(np.corrcoef(resid, d.bw_sh)[0, 1], 2))    # +0.54
The chart script recomputes every number in this article from the raw log on each build — the band counts, the shares, the regression, the partial correlations, and the Pythagorean residuals — and asserts the replayed win totals against the ratings file. Nothing is hand-entered.
Sources & method
- Game-by-game results: bundled
data_layer/nba_home_results.csv— 1,231 rows covering 2023-24, of which the 2023-12-09 In-Season Tournament final (Pacers at Lakers) is excluded as a non-regular-season game, leaving all 1,230 regular-season results. Ratings and final records: bundleddata_layer/nba_ratings.csv. Underlying data: Basketball-Reference. - Definitions: blowout win = final margin ≥ 15; one-score win = margin ≤ 3 (one possession); mid win = 4–14. League bands over the 1,230 games: 399 / 660 / 171 (32.4% / 53.7% / 13.9%).
- Method: shares are per-team fractions of that team's wins; the style test is OLS of NRtg on W/L% (R² 0.956) versus W/L% plus both shares (R² 0.979), with first-order partial correlations and Fisher 95% CIs at n=30; Pythagorean expectation uses Morey's 13.91 exponent on season PF/PA. All figures computed 2026-07-31; the chart is
chart_win_styles.py. - Related on this site: how often is an NBA game actually close · Pythagorean expectation in the NBA standings · the most and least consistent teams · how much of an NBA game is luck.