Here is a question that sounds simple and isn’t: which NBA team was the most consistent in 2023–24? Most people, asked that, reach for a good team — a contender that grinds out the same competent night over and over. But “consistent” and “good” are two different measurements, and when I actually computed them from the season’s game results, they came apart almost completely. The steadiest team in the league — the one whose nightly margin bounced around the least — was one of the worst teams in basketball. The wildest team, the one whose scoreline you could least predict, went to the Finals. That gap is the whole story, and it’s worth sitting with.
Two numbers, not one
To get there I measured every team two ways from the same raw material: its point margin in each of its roughly 82 regular-season games, taken from the team’s own perspective (win by 8, that’s +8; lose by 12, that’s −12). The first number is the mean of those margins — the average nightly result, which is just a clean proxy for how good the team is. The second is the standard deviation (SD) of those same margins — how far a typical night strays from that average, which is what I mean by consistency. A team with a low SD plays close to the same game every night. A team with a high SD is a mood ring: blowout win, blowout loss, you never quite know which.
These two numbers answer genuinely different questions. The mean asks “how good?” The SD asks “how steady?” And the headline finding is that across the 30 teams they’re nearly independent — knowing one tells you almost nothing about the other.
The four corners
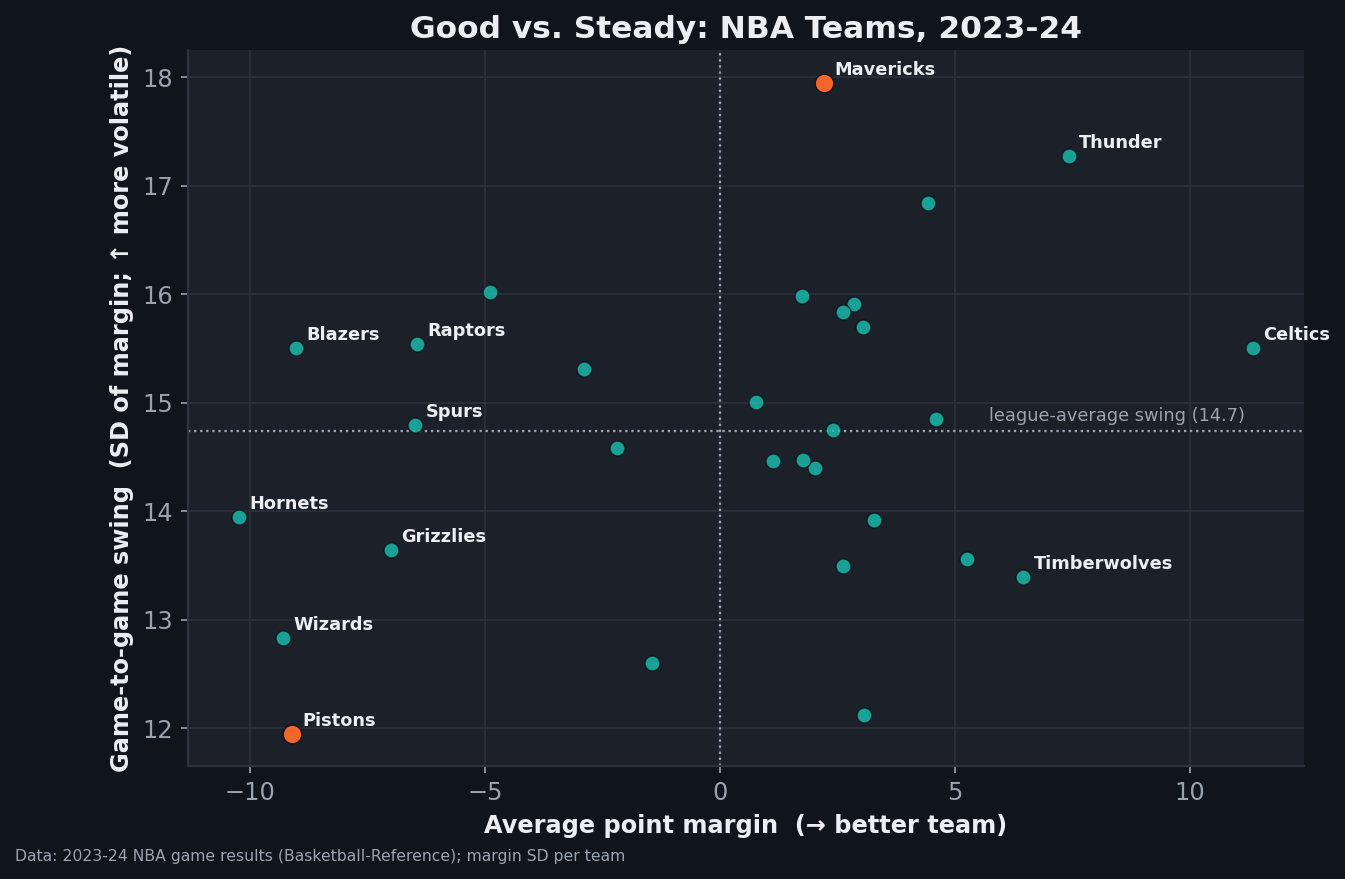
Because the two measurements don’t move together, every team lands in one of four quadrants, and all four were occupied. You could be steady and bad, steady and good, wild and bad, or wild and good — and the season handed me a clean example of each.
The steadiest team in the entire league was the Detroit Pistons, with an SD of just 11.95. They were also, by margin, one of the worst: a mean of −9.11 points a night. Detroit had a historically rough season, and the way they were bad was relentlessly on-brand — they lost in a narrow, predictable band. Low variance didn’t mean reliable in the comforting sense; it meant reliably behind. Consistency, it turns out, is perfectly happy to describe a team that consistently can’t win.
At the opposite pole, the Dallas Mavericks were the most volatile team in the league, SD of 17.95, on a mean margin of only +2.21. By the regular-season scoreboard they were barely above water and impossible to forecast from one night to the next — and then they reached the 2024 NBA Finals. The single wildest team in basketball was the one that ran deepest into June. If you had ranked the league purely by steadiness, you’d have buried the eventual conference champion near the bottom.
The other two corners fill in the picture. The Minnesota Timberwolves were both steady and good — mean +6.45 on an SD of 13.39. That combination isn’t an accident: a genuinely elite defense produces a high, stable floor, because you can have an off shooting night and still win on the strength of stops. The Oklahoma City Thunder were the opposite kind of good — +7.41 mean, but a Dallas-like 17.27 SD. A young team with a sky-high ceiling and a habit of winning by 30, which is “good” volatility but volatility all the same. (For a calmer contrast, the Phoenix Suns sat on the steady side, SD 12.13, mean +3.06.) Four teams, four corners. Steady and good are simply not the same axis.
How to compute it for one team
The mechanics are worth walking through, because they’re the kind of thing anyone can do with a spreadsheet. Take Detroit. List their margin in all 82 games — one signed number per game. Average those, and you get roughly −9.1: the mean. Now measure how far each game’s margin sits from that −9.1, square those gaps, average them, and take the square root. That’s the standard deviation, and for Detroit it comes out to about 12.0 — the lowest in the league. Run the identical recipe on Dallas and the SD lands near 18.0, the highest. Same arithmetic, wildly different result.
What does an SD around 15 — the league-typical figure — actually feel like? It means the nightly margin routinely strays 15 points from a team’s average. Put that next to the average margins above, almost all of which are in single digits, and the punchline lands: the swing dwarfs the signal. A team you’d favor by 5 on paper can comfortably win by 20 or lose by 20 on any given night without anything unusual happening — that’s well inside one standard deviation. The score of a single NBA game is mostly telling you about that night, not about the teams. I’ve made a version of this argument before in how much of an NBA game is luck, and the SD of margin is basically that idea with a number attached.
Where the league sat, on average
That 14.74 is the reference line for everything else. A typical team’s margin bounced around by nearly 15 points night to night — which is why Detroit’s 11.95 reads as genuinely tight and Dallas’s 17.95 as genuinely chaotic. They’re both meaningful departures from the middle, just in opposite directions. It also reframes how often a game is really up for grabs: when the swing is this wide, a lot of contests that look like blowouts or routs were closer to coin flips that happened to break hard. I dug into that separately in how often an NBA game is actually close, and the variance here is the engine underneath it.
What this does and doesn’t measure
I want to be honest about what an SD of margin is not. It is a measure of volatility, full stop — not quality, and not clutchness. Crucially, the SD can’t tell the difference between good and bad chaos: a high number can come from blowout wins (OKC) or blowout losses (a bad team that occasionally gets run off the floor), and the arithmetic treats a +30 and a −30 as equally “inconsistent.” That’s why you must always read the SD next to the mean. Volatility without direction is half a sentence.
There are other caveats I won’t paper over. Margin variance gets inflated by things that have nothing to do with a team’s true character: load management resting stars in some games and not others, tanking down the stretch of a lost season, and schedule quirks like the back-to-backs that drag a tired team to a blowout loss. (Some of that overlaps with what I found looking at home-court advantage in the 2023-24 games — context bends the margin.) And a single season is a genuinely small sample for estimating a variance; SD is a jumpier statistic than a mean, so I’d treat these figures as a strong sketch, not gospel. Finally, margin SD is not the same as win–loss streakiness — a team can post wildly different margins while alternating wins and losses, or rattle off a steady streak of one-possession games. Different question, different math.
Why margin in the first place
Underneath all of this is an older idea: that point margin is a cleaner signal of a team’s strength than its win–loss record. A win is a win whether by 1 or by 30, but the 30-point night carries far more information about how the two teams actually compare — this is bedrock in the basketball-analytics tradition that traces back to Dean Oliver and the people who built the modern stat sheet. Once you accept margin as the better raw signal, splitting it into a mean and a variance is the natural next step. The mean is the part the season rewards; the variance, the closely related cousin of the three-point bounce I wrote about in three-point variance, is the part that decides any single night. Treating the average and the spread as one thing is the mistake; they answer different questions, and 2023-24 made the difference vivid.
Reproducing it
None of this is exotic. For each of the 30 teams, collect its per-game point margin from the bundled nba_home_results.csv — every 2023-24 regular-season game — then take the mean and the population standard deviation of that team’s margins. Sort by the SD and the steadiest-to-wildest ranking falls out; plot SD against mean and you get the scatter above, with its four populated corners. The whole computation, including the league-average 14.74 and the chart itself, is reproduced by charts/chart_team_consistency.py. Point it at the CSV and you’ll land on the same numbers I did.
The takeaway
Consistency feels like a virtue, so we assume it tracks quality. It doesn’t. The steadiest team in the 2023-24 NBA was Detroit, and they were steadily terrible; the wildest was Dallas, and they made the Finals. Steadiness is just the width of a team’s outcomes, and width says nothing about where those outcomes are centered. Measure both — the average and the spread — and you stop confusing a team you can predict with a team you should fear.
Sources & Further Reading
- Free textbook: Chapter 5: Descriptive Statistics in Basketball — the theory behind this, at DataField.dev.
- Data & chart code: the bundled
data_layer/nba_home_results.csv(every 2023-24 regular-season game, from Basketball-Reference), with means and standard deviations computed bycharts/chart_team_consistency.py. - Related on this site: how much of an NBA game is luck and how often an NBA game is actually close.