Across all 1,231 regular-season games of 2023-24, the home team won 54.4% of the time and outscored visitors by an average of 2.2 points a night. That much you could have guessed. The part that surprised me sits inside the margins: home court is nearly invisible in close games and double-digit games — both hover right at a coin flip — and then it spikes in blowouts, where the home team takes 62% of the games decided by 16 or more. Home-court advantage, at least in this season, lives in the laughers.
The finding, stated plainly
I pulled the bundled game log — every 2023-24 regular-season result, with the away team, away points, home team, and home points — and computed the home margin for each game as home_pts − away_pts. There are no ties in basketball, so every game falls cleanly on one side. The top-line numbers:
- Home win rate: 54.35% (669 of 1,231 games).
- Average home margin: +2.16 points per game; the median is +2.
- Spread of margins: a standard deviation of 15.6 points — games swing enormously around that small average.
That +2.2 is the classic shape of NBA home-court advantage, and it is smaller than people assume. It is not a four- or five-point gift. It is two points and change, a single possession's worth of edge, sitting on top of a mountain of game-to-game noise. But the average hides the more interesting story, which only shows up when you stop asking did the home team win and start asking which kinds of games did the home team win.
The original exhibit: home edge by margin
So I bucketed every game by its final margin, ignoring direction, and asked: of the games decided by this many points, what share did the home team win? If home court were a uniform nudge — a steady two points poured into every game alike — you would expect the home win rate to sit a bit above 50% across the board, maybe tilting higher in the closest games where two points decides everything. That is not what the data shows.
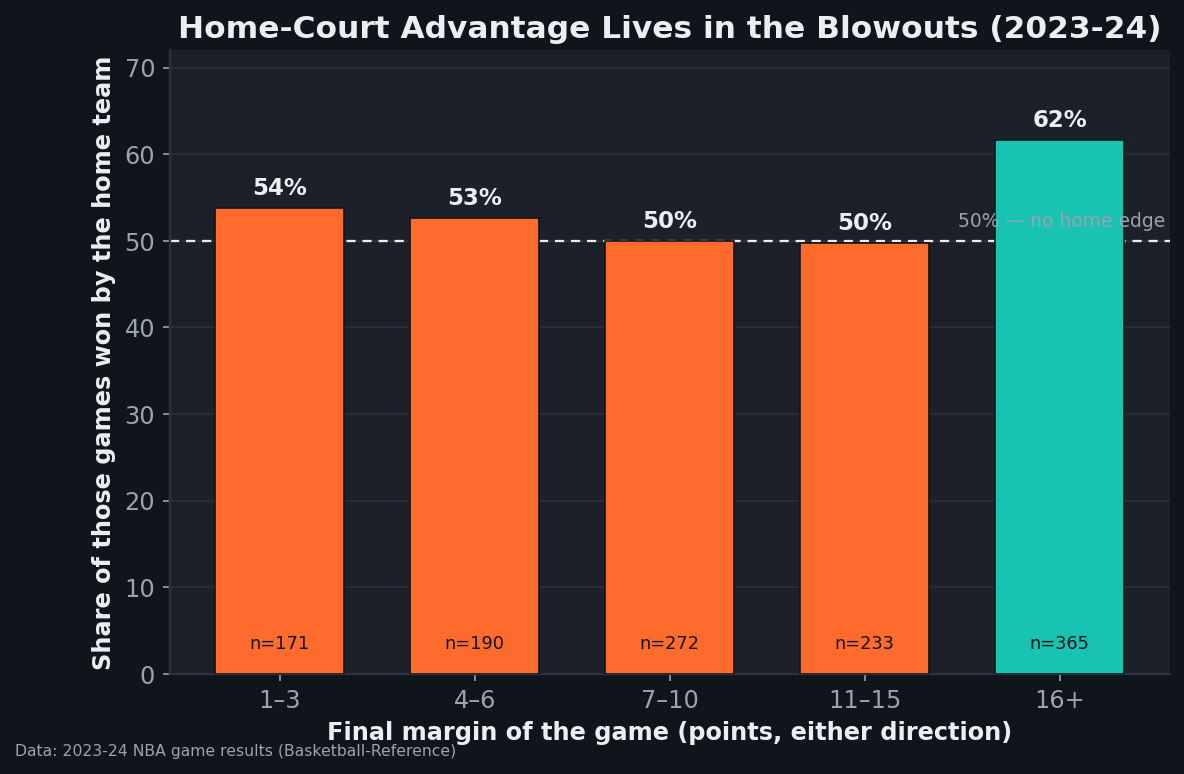
home_pts − away_pts; chart generated by the site's charts pipeline with a stamped provenance footer.Read left to right. Games decided by 1–3 points went the home team's way 53.8% of the time (171 games). The 4–6 bucket: 52.6% (190 games). Then the edge evaporates. Games decided by 7–10 points split exactly 50.0% (272 games); the 11–15 bucket actually tips slightly toward the road team at 49.8% (233 games). And then the blowouts: of the 365 games decided by 16 or more, the home team won 61.6%. That single bar carries the season's home-court advantage almost by itself.
Put it another way. Of the 365 blowouts, 225 were home blowouts and 140 were road blowouts. That 85-game gap — home teams winning big roughly 60% more often than they lose big — is most of where the +2.2 average margin actually comes from. The home edge is not a thin, even glaze spread over every game. It is concentrated in the nights when one team buries the other, and far more often than not, the team doing the burying is at home.
Worked example: computing two real margins
The arithmetic is deliberately boring, which is the point — every number above is just this, repeated 1,231 times. Take opening night, October 24, 2023. The Lakers visited Denver and lost 107–119. Home margin is 119 − 107 = +12: a home win, and it lands in the 11–15 bucket. The same night, Phoenix visited Golden State and won 108–104. Home margin is 104 − 108 = −4: a home loss, sorted into the 4–6 bucket on the road-win side. One home win, one home loss, both from the opening slate — a fair miniature of a season that ended up just barely north of even.
And the most extreme home result on the board: on January 11, 2024, Oklahoma City hosted Portland and won 139–77. That is a home margin of +62 — the largest in the dataset, and exactly the kind of game that fills the 16+ bar. No close game can move the average margin much; a single +62 night moves it a great deal. That asymmetry is worth keeping in mind when you read any "average" home-court number.
Reproducing it
Nothing here requires anything fancier than pandas. The whole analysis is a load, a subtraction, and a group-by:
import pandas as pd

df = pd.read_csv("data_layer/nba_home_results.csv")
df["margin"]   = df["home_pts"] - df["away_pts"]
df["absm"]     = df["margin"].abs()
df["home_win"] = df["margin"] > 0

print(df["home_win"].mean())   # 0.5435  -> 54.35% home win rate
print(df["margin"].mean())     # 2.156   -> +2.16 avg home margin

# Home win rate within each absolute-margin bucket
buckets = [(1, 3), (4, 6), (7, 10), (11, 15), (16, 200)]
for lo, hi in buckets:
    sub = df[(df["absm"] >= lo) & (df["absm"] <= hi)]
    print(lo, hi, round(sub["home_win"].mean() * 100, 1), len(sub))
# 1  3  53.8 171   |  7 10  50.0 272   |  16 200  61.6 365
That is the entire exhibit. The chart above is the same group-by drawn as bars, with a 50% reference line and a provenance footer stamped on by the site's chart toolkit. If you want to see how points-per-possession underwrites all of this scoring math, I worked through the unit of account in the value of a possession, and the team-strength rollup in offensive and defensive rating.
Why might the edge hide in blowouts?
I want to be careful here, because this is where analysis tips into speculation. The data tells me where the home edge sits; it does not tell me why. A few plausible mechanisms, none of which I can prove from a single season of final scores:
Garbage time runs downhill. Once a game is decided, the trailing road team empties its bench and stops competing for a result that no longer matters; the leading home team, riding the crowd, keeps the margin fat. A 12-point home lead in the third can become a 22-point final almost passively. The reverse — a road team padding a blowout in a hostile building — happens, but apparently less. I dug into how those minutes distort everything they touch in garbage time distortion.
Close games are coin flips by construction. A game decided by three points was, by definition, nearly a tie — whatever home advantage existed got spent earlier and the outcome came down to a late shot, a whistle, a bounce. There is barely any room left for a systematic two-point edge to express itself in the win column. So it makes sense that the closest buckets sit near 50%, not far above it. Three-point variance, which I covered in the three-point variance problem, swamps small edges in exactly these games.
These are hypotheses, not findings. The honest version of this article's thesis is narrow: in 2023-24, the home win rate was 54%, and that edge was concentrated in blowouts rather than spread evenly. The mechanism is a separate question I have not answered.
Limitations — and they are real
I would not want anyone quoting these numbers as eternal truths, so here is where they break:
- One season. This is 2023-24 and only 2023-24 — 1,231 games, which is a lot of games but one sample of one year. Home win rates bounce around year to year; the league-wide figure has drifted down over the past decade-plus from the old 60%-ish norm toward the mid-50s, and a single season can land a couple of points either way by chance. The blowout pattern in particular rests on 365 games in one bucket; I would want several seasons before calling it a law rather than a season.
- Home court conflates several things. "Home advantage" is a bundle: the crowd, sleeping in your own bed, no travel, familiar rims and sightlines, and — importantly — scheduling. Road teams are more often on the second night of a back-to-back, more often jet-lagged, more often deep into a road trip. Some of what looks like a home court effect is really a rest-and-travel effect that happens to correlate with venue. I split rest from venue as far as a season of games allows in rest vs. performance, and the two are genuinely hard to disentangle.
- Final scores only. This dataset is scores, not possessions or play-by-play. I cannot tell you whether the home blowout edge is an officiating effect, a bench effect, or a coaching-decision effect, because I cannot see inside the games — only how they ended.
- Era and rules caveats. Modern travel (charter flights, sports science, load management) has almost certainly shrunk home advantage from where it sat in the 1980s and 1990s, and rule changes that boosted scoring leaguewide change the texture of every margin. A blowout in a 115-points-per-night league is a different animal from a blowout in a 95-point league. None of this is fixed across eras.
How it fits the field
Home advantage is one of the most-studied effects in sports, and the honest consensus is humbler than the folklore. Moskowitz and Wertheim's Scorecasting made the case that a surprising share of home advantage across sports traces to officiating bias under crowd pressure rather than to players simply performing better at home — a reframing that, true or not in the NBA's case, should make anyone cautious about attributing the effect to a single tidy cause. The natural-experiment seasons — the empty-arena "bubble" and fan-less stretches of 2020 — gave researchers a rare look at home advantage with the crowd subtracted, and the effect shrank but did not vanish, which suggests the crowd is part of the story and not the whole of it.
My small contribution to that literature is only this: in one recent, ordinary, full-crowd season, the NBA home edge was real but modest, and it did not live where you would expect. It hid in the blowouts. If you want to keep pulling on these threads, the four-factors framework is where team quality and game outcomes meet — I laid it out in the four factors — and if you would rather compute your own splits and rates instead of taking mine, the Calculators hub has the per-possession and efficiency tools to do it.
The takeaway
Home court in 2023-24 was worth about two points and a 54% win rate — smaller than the legend, and lumpier. Close games were coin flips; double-digit games were coin flips; the edge showed up almost entirely in the games decided by 16 or more, where home teams won 62%. The average margin you read in a preview is a true number that hides a false picture. Home advantage is not a steady tax levied on every visitor. It is a tendency to win big at home, averaged out across a season of games that were mostly toss-ups anyway.
Sources & Further Reading
- For the fundamentals, see Chapter 17: Team Offensive Efficiency in DataField.dev’s free textbook library.
- All figures computed directly from the bundled 2023-24 NBA game results (
data_layer/nba_home_results.csv, 1,231 games), sourced from Basketball-Reference. Home margin = home points − away points; buckets and win rates as shown in the code above. - Tobias J. Moskowitz and L. Jon Wertheim, Scorecasting: The Hidden Influences Behind How Sports Are Played and Games Are Won (2011) — the case that home advantage owes more to officiating under crowd pressure than to player performance.
- The 2020 empty-arena "bubble" and fan-less games serve as a natural experiment on the crowd component of home advantage; analyses found the effect shrank but persisted.
- Standard team ratings, pace, and net rating context: NBA.com/stats and the Basketball-Reference Glossary.