On New Year's Day, Utah beat Dallas by 37 — four weeks after losing to the same Mavericks by 50. Ten days later, Portland walked into Oklahoma City carrying a 43-point humiliation from November and lost by 62, the widest margin of the entire NBA season. Both games were “revenge games.” Both make great television. So I pulled all 258 rematches that followed a 15-plus-point loss out of the 1,230 regular-season games of 2023-24 and measured what the blown-out team actually did. The broadcast version is true and useless: blown-out teams came back 21.1 points better in the rematch. Strip out regression to the mean, the venue flipping, a baseline that secretly remembers the blowout, and a calibration correction that most quality models skip — and revenge is worth +1.31 points, 1.5 standard errors from zero. A result that size shows up by chance about one time in eight. And it fails every signature test an actual motivational force would pass.
What counts as a revenge spot here
The bookkeeping first. The bundled game log has 1,231 rows; one of them — the December 9 In-Season Tournament final, Pacers 109 at Lakers 123 — is not a regular-season game and gets dropped, leaving 1,230 games that put all 30 teams at exactly 82. (The replayed records match the bundled ratings file for all 30 teams; that audit runs inside the chart script every build.) Those 1,230 games sort into 435 head-to-head pairs, and each pair's meetings, taken in date order, produce 795 rematches — every game that had a same-season prequel. I take each rematch from the perspective of the team that lost the previous meeting. If that loss was by 15 or more — and 399 of the season's 1,230 games, 32.4%, ended that way — the rematch is a revenge spot. There are 258 of them, and the average previous loss in the group was a 23.7-point beating.
One number you'll need throughout: home-court advantage in this file is +2.15 points — the average home margin across the 1,230 games, with the home team winning 54.3% of the time. (The site's home-court piece quotes +2.16 and 54.35% because it averages all 1,231 rows including the IST final; same file, one row apart.)
The broadcast number: 21 points better
Here's the stat a pregame show would run. Teams in a revenge spot had just lost this matchup by an average of 23.7. In the rematch they lost the matchup by an average of just 2.6 — a 21.1-point improvement — and won the game outright 41.9% of the time. Told that way, revenge sounds enormous.
Told honestly, almost all of it was never revenge. About 18 of those 21 points are pure regression to the mean: a 24-point loss is a team's worst night against that opponent, not its typical one, and the correct comparison for the rematch is what these two teams usually do to each other, not the outlier that started the story. I made the same argument about post-blowout “bounce-back” games, where the entire next-game response evaporated once team quality entered the room. Another point is just geography: blowouts disproportionately happen to road teams — 62.4% of the original beatings happened away from home — while 59.7% of the rematches put the humiliated team at home. The venue term alone swings +0.95 points between the two games. Mean reversion, plus a home date, dressed up as psychology.
What's left after the obvious corrections is the interesting part.
Three baselines, one shrinking premium
I gave the revenge hypothesis three chances, each against a stricter baseline for what the rematch should have looked like.
| Baseline the rematch is measured against | “Revenge premium” | Distance from zero |
|---|---|---|
| The blowout itself (the broadcast version) | +21.1 pts | — |
| Season point differential per game + home court | +2.34 (SE 0.83) | 2.8 SE |
| Same, but the baseline forgets both games of the story | +1.82 (SE 0.86) | 2.1 SE |
| Same, calibrated for noise in 82-game ratings | +1.31 (SE 0.86) | 1.5 SE |
Chance one: quality plus venue. Expected rematch margin = (loser's season point differential per game − winner's) ± 2.15 for home court. Against that, the revenge group beat expectation by +2.34 points, 2.8 standard errors from zero — the kind of result that happens by chance one time in two hundred. If I'd stopped here, this article would be titled “Revenge Games Are Real” and it would be wrong.
Chance two: stop letting the baseline remember the blowout. Here's the trap. Utah's season-long point differential includes the 50-point Dallas game. The very humiliation we conditioned on drags the loser's rating down and pumps the winner's up, so the “expectation” for the rematch is poisoned in exactly the direction that manufactures a revenge effect. For an average 23.7-point blowout, that one game shifts the pair's rating gap by 2 × 23.7 / 82 ≈ 0.6 points all by itself. Recompute every team's differential excluding both games of each story — the blowout and the rematch, 80 games instead of 82 — and the premium drops to +1.82 (SE 0.86). The same artifact was inflating every previous-meeting loser, by the way, not just the humiliated ones: across all 795 rematches the loser's apparent edge over the naive baseline is +1.26, and it shrinks to a statistically unremarkable +0.63 once the baseline plays fair.
Chance three: calibrate the model. A team's 82-game point differential is a noisy estimate of how good it actually is, and models built on noisy inputs overshoot at the extremes. Regress every 2023-24 home margin on the (leave-that-game-out) differential gap and the fitted line is margin = 2.18 + 0.896 × gap — the slope is 0.896, not 1. A literal differential model therefore over-predicts mismatches, and revenge spots are, by construction, mismatches: someone just lost by 24 to this opponent. Feed the clean ratings through the calibrated line and the revenge premium lands at +1.31 points, SE 0.86. One and a half standard errors. About one in eight by luck alone — and I haven't yet mentioned that I sliced this sample several ways, which is exactly how one-in-eight results get found.
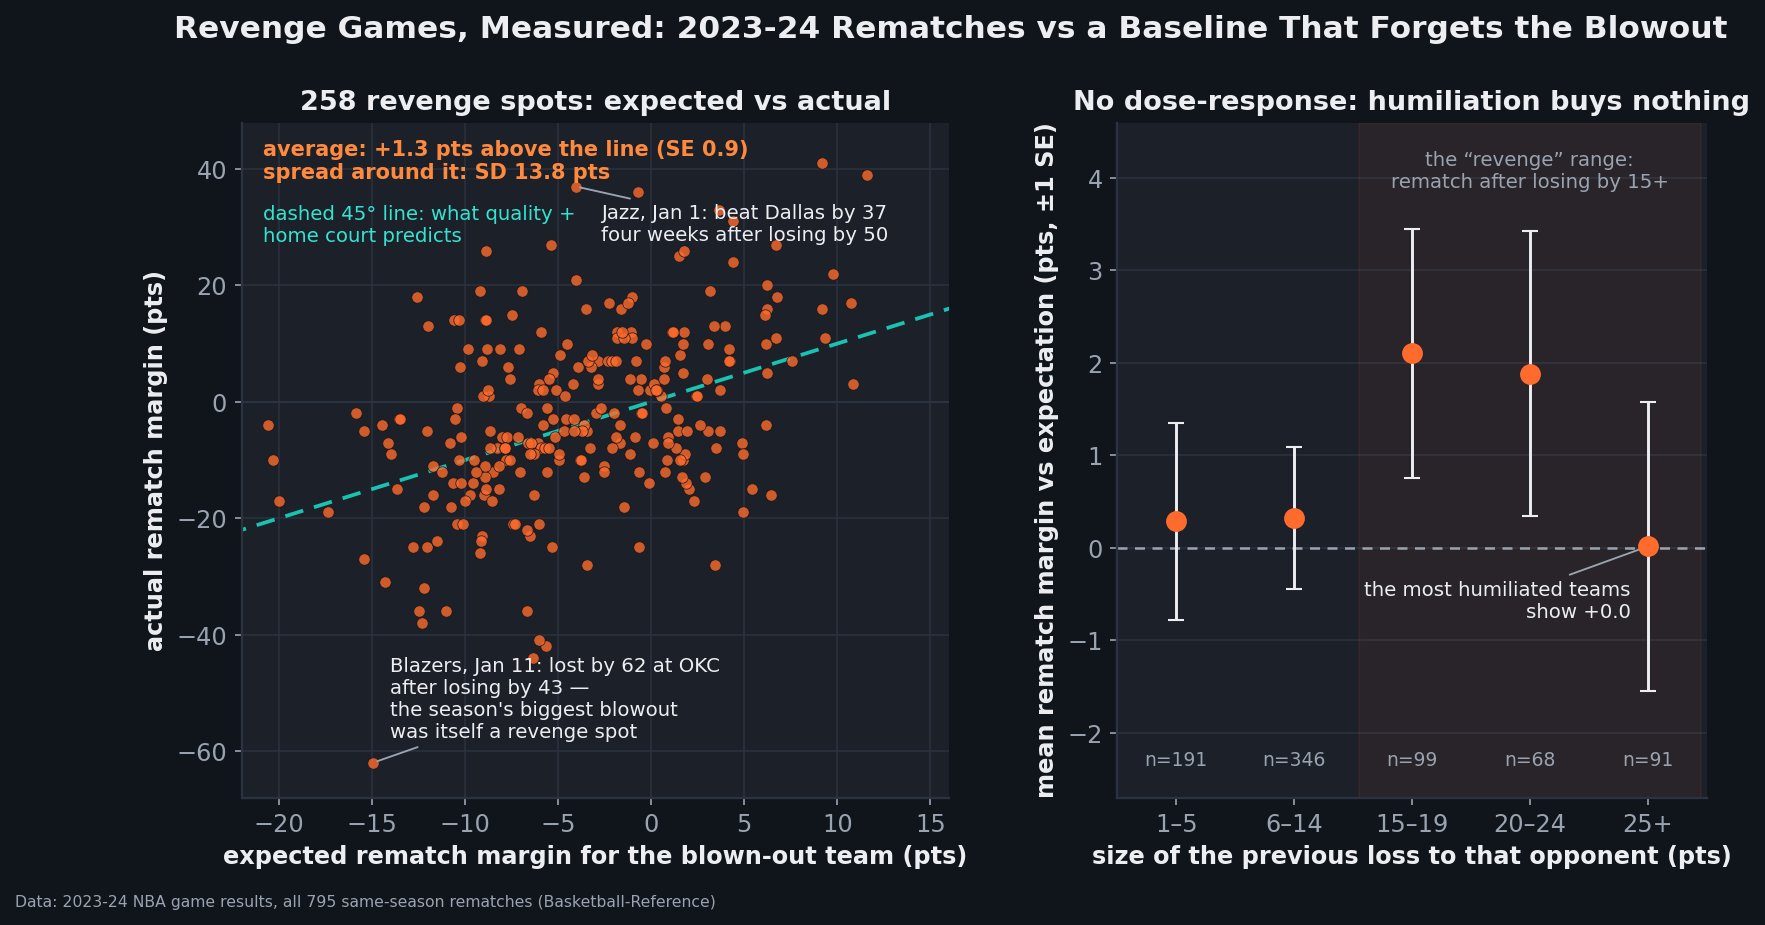
data_layer/nba_home_results.csv — 1,231 rows, with the 2023-12-09 In-Season Tournament final excluded as non-regular-season, leaving 1,230 games — audited against data_layer/nba_ratings.csv. Chart by charts/chart_revenge_games.py.The signatures a real force would leave
Even a residual +1.31 might mean something if it behaved like motivation. It doesn't. Four signatures, four misses:
- No dose-response. If humiliation fuels revenge, more humiliation should buy more points. The calibrated premium after a 15-19-point loss is +2.11; after 20-24 it's +1.88; after 25-plus — the games that produce the angriest locker-room quotes — it's +0.01 on 91 rematches. Across all 795 rematches, the correlation between the size of the previous loss and out-performance in the rematch is r = +0.03. The curve a psychologist would draw simply isn't there.
- No home-crowd amplification. The revenge narrative leans hard on the home date — the wounded team in front of its own fans. Premium with the rematch at home: +1.34 (n=154). On the road: +1.27 (n=104). Identical to within a tenth of the noise.
- No urgency gradient. Fresh wounds should cut deepest. Rematches within 31 days of the blowout (half the sample) show a premium of +0.16; rematches longer than 31 days out show +2.52. The largest effect any slice of this sample produces — and it's still only 1.9 SE — runs backwards from the theory, which is what noise looks like when you cut a 258-game sample five ways.
- No consistency. The spread of outcomes around expectation in revenge spots has a standard deviation of 13.8 points, and only 51.9% of them beat their baseline at all — a coin flip. The median revenge game? A four-point loss.
And here is the full outcome table for the 258 revenge spots — the distribution nobody airs:
| Rematch result for the blown-out team | Games | Share |
|---|---|---|
| Won by 10+ | 54 | 20.9% |
| Won by 1-9 | 54 | 20.9% |
| Lost by 1-9 | 71 | 27.5% |
| Lost by 10+ | 79 | 30.6% |
That's 108 wins, 150 losses. Forty-seven of the 258 — 18.2% — got blown out by 15-plus again. Only 30 of them, 11.6%, delivered the made-for-TV 15-point revenge win. The rematch after a beating is, overwhelmingly, just another game between the same unequal teams.
Worked example: Utah–Dallas, twice, and Portland's month
Take the season's loudest revenge story and run the arithmetic. December 6: Jazz lose 147-97 in Dallas, a 50-piece. January 1 rematch in Salt Lake City. Utah's point differential across its other 80 games was −4.85 per game; Dallas's was +2.10; add +2.15 of home court and the fair expectation was Utah by −4.80 — call it a five-point Dallas win (−4.05 after calibration). Actual result: Jazz 127, Mavericks 90. Utah beat the baseline by 41 points, the largest revenge overshoot of the season. If you saw that game, no statistic will talk you out of revenge.
So watch the same fixture ten weeks later. March 21: Utah loses in Dallas by 16 — a fresh revenge spot, rematch just four days out, at home, wound still open. March 25: Dallas 115, Utah 105. The Jazz missed their baseline by six. Same teams, same season, same setup; opposite verdict.
Portland's January is the cautionary bookend. November 19: Blazers lose to the Thunder by 43 at home. The January 11 revenge spot in Oklahoma City produced a 139-77 loss — 62 points, the biggest margin in the 1,230-game file, 47 points below even the grim −14.9 the calibrated model expected. Twelve days later that disaster was itself the revenge spot, and Portland — expected to lose by about 16 — lost 111-109, beating the baseline by 14. One fixture handed out “revenge is fake” and “revenge is real” data points twelve days apart. That is what a 13.8-point standard deviation does to any one-game story you want to tell.
What this file can't see
- One season. 258 revenge spots is a real sample but a single year of scheduling; the method transfers to any season, the +1.31 shouldn't be quoted as a constant of nature.
- No rosters. The log has scores, not lineups. Some blowouts happen on rest nights and some rematches happen against them — the 14-68 Pistons “avenging” a March loss by winning at playoff-bound Dallas by 18 on April 12, +31 over baseline, has obvious alternative explanations a five-column CSV cannot check. Injuries, returns, and end-of-season motivations all live outside this file.
- Rest and schedule spots aren't modeled. The baseline knows quality and venue, not back-to-backs. Those effects are worth a point or two and should distribute roughly randomly across 258 spots, but nobody has audited that here.
- Multiple comparisons. I cut the sample by size, venue, and timing — eight-plus looks at the same 258 games, so a 1.5-SE headline and a 1.9-SE slice are about what a true zero would hand out. That the biggest slice (late rematches, +2.52) points the wrong way for the theory is the tell.
- “Probably” is doing honest work. +1.31 ± 0.86 is consistent with zero and also consistent with a real point of revenge. What the data rules out is the broadcast-sized effect; what it can't do is prove an exact zero. Playoff rematches — where the revenge mythology actually lives — aren't in a regular-season file at all.
Reproduce it
One pass over the log builds the rematch table; the whole test is twenty lines.
import pandas as pd

g = pd.read_csv("data_layer/nba_home_results.csv")
g = g[~((g.date == "2023-12-09") & (g.away_team == "Indiana Pacers")
        & (g.home_team == "Los Angeles Lakers"))]   # IST final: not reg. season
g["hm"] = g.home_pts - g.away_pts                     # 1,230 games remain

tot = {}                                              # season point differential
for _, x in g.iterrows():
    tot[x.home_team] = tot.get(x.home_team, 0) + x.hm
    tot[x.away_team] = tot.get(x.away_team, 0) - x.hm

pairs = {}
for _, x in g.sort_values("date").iterrows():         # 435 head-to-head pairs
    pairs.setdefault(frozenset((x.home_team, x.away_team)), []).append(x)

exc = []
for ms in pairs.values():
    for prev, cur in zip(ms, ms[1:]):                 # 795 rematches
        loser = prev.away_team if prev.hm > 0 else prev.home_team
        winner = prev.home_team if prev.hm > 0 else prev.away_team
        home = cur.home_team == loser
        actual = cur.hm if home else -cur.hm
        q = ((tot[loser] + abs(prev.hm) - actual)      # rating gap that forgets
             - (tot[winner] - abs(prev.hm) + actual)) / 80   # both games
        exp = (2.182 if home else -2.182) + 0.896 * q  # line fit on all 1,230
        if abs(prev.hm) >= 15:
            exc.append(actual - exp)
# len(exc) == 258; mean == +1.31; SE == 0.86
The calibration line (2.182, 0.896) comes from regressing every home margin on the leave-one-out differential gap across all 1,230 games; charts/chart_revenge_games.py refits it from the raw log on every build, recomputes all 795 rematches, and asserts the replayed records against the ratings file. Nothing is hand-entered.
Sources & method
- Game-by-game results: bundled
data_layer/nba_home_results.csv— 1,231 rows covering 2023-24, of which the 2023-12-09 In-Season Tournament final (Pacers at Lakers) is excluded as a non-regular-season game, leaving all 1,230 regular-season results. Underlying data: Basketball-Reference. - Audit: records replayed from the game log match bundled
data_layer/nba_ratings.csv(30 teams, final W-L) exactly, and every team lands on 82 games. Home-court advantage is +2.146 over the 1,230 regular-season games (the home-court article's +2.156 includes the IST final row). - Method: 435 pairs → 795 consecutive-meeting rematches, taken from the previous loser's perspective; expectation = calibrated line (slope 0.896) over a rating gap that excludes both games of each story; error bars and SEs are ±1 standard error of the mean. All figures computed 2026-07-28; the chart is
charts/chart_revenge_games.py. - Related on this site: do teams bounce back after a blowout (next game, any opponent) · who wins the season series · how much of an NBA game is luck.