Every NBA broadcast has a version of the same sermon: a team that just got embarrassed by 25 will "come out with something to prove," or, in the pessimist's cut, has "shown you who they are." Both stories make a testable claim — that last game's result carries information about the next one. So we tested it, on every consecutive-game pair of the 2023-24 season: 2,432 of them. The raw numbers look like the sermon. Adjust for one thing — who the team actually is — and the whole effect evaporates to a correlation of +0.017. The response game is a story we tell about schedules; it is not a thing that shows up in scores.
The thesis: momentum between games is team quality in disguise
Our position before the table: what looks like game-to-game momentum is almost entirely selection. Good teams win by 20 more often, and good teams also win their next game more often — not because the blowout did anything, but because being good causes both. The honest test is not "how often do teams win after X" but "how do teams play after X relative to their own season baseline." The first question produces highlight-show numbers. The second produces flat bars.
The exhibit: the same data, told twice
We bucketed every game of 2023-24 by its margin — blowout loss (20+) through blowout win (20+) — and looked at each team's next game two ways: the raw win rate, and the next game's point margin minus that team's full-season average margin.
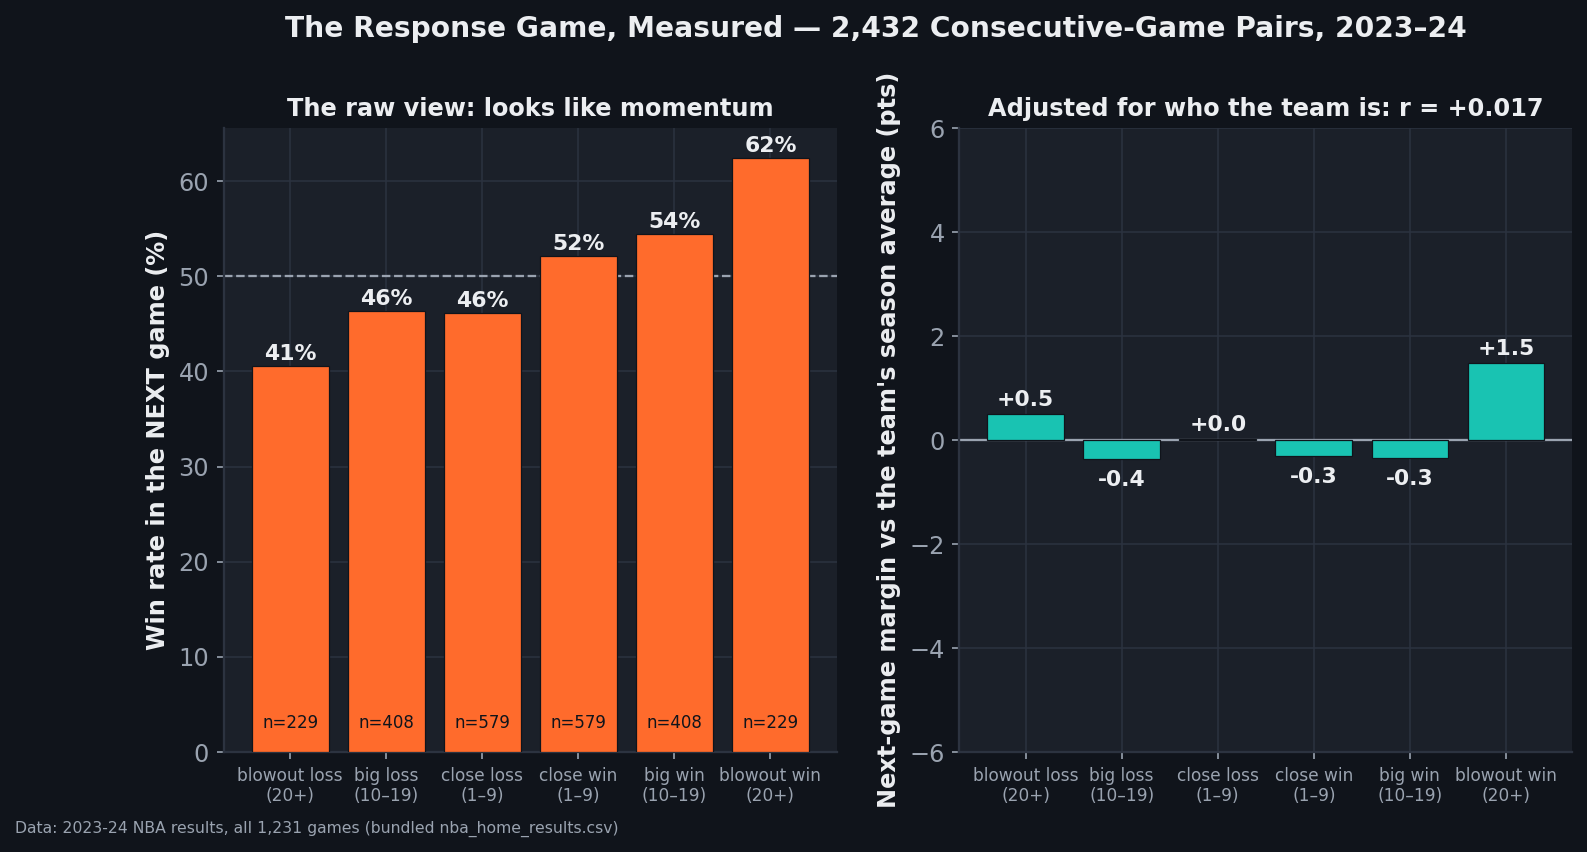
data_layer/nba_home_results.csv (all 1,231 games of 2023-24); buckets and correlations computed per team in chronological order. Charted by chart_bounce_back.py with a stamped provenance footer.| Previous game | Pairs | Next-game win rate | Next margin vs team average |
|---|---|---|---|
| Blowout loss (20+) | 229 | 40.6% | +0.50 |
| Big loss (10–19) | 408 | 46.3% | −0.36 |
| Close loss (1–9) | 579 | 46.1% | +0.01 |
| Close win (1–9) | 579 | 52.2% | −0.31 |
| Big win (10–19) | 408 | 54.4% | −0.34 |
| Blowout win (20+) | 229 | 62.4% | +1.49 |
Reading the two views
The left column is what a pregame graphic would show you: teams coming off a blowout loss win just 41% of the time, teams coming off a blowout win 62%. If you stopped there, you'd conclude the previous game echoes loudly into the next one — that losing big begets losing.
The right column asks the better question. A team that loses by 25 was, more often than not, a bad team having a normal night — the 2023-24 bottom-feeders populate that bucket over and over. Of course they lose the next game too; they lose most games. Subtract each team's season-average margin and the "hangover" disappears entirely: teams coming off a blowout loss actually played half a point better than their own norm the next night. Every middle bucket sits within a third of a point of zero. Across all 2,432 pairs, the correlation between one game's margin and the next game's baseline-adjusted margin is +0.017 — for practical purposes, zero. The one bump with any size, +1.5 after blowout wins, carries an obvious confound: 20-point wins cluster inside soft stretches of schedule, and the next opponent comes from the same soft stretch. The data has no opponent-strength adjustment, so we’d bet most of that +1.5 is the calendar, not the mood.
Why the myth survives
Partly because the raw view is technically true — teams off blowout losses do lose more, and a broadcast has no obligation to tell you why. And partly because bounce-back games are memorable: when a humiliated team wins by 15, the narrative confirms itself; when they lose again, it was "who they are." Heads the story wins, tails the story wins. This is the same mechanism we found in win streaks (indistinguishable from random sequencing of team quality) and in single-game luck — the NBA's night-to-night variance is enormous, and fans and broadcasters alike backfill stories onto noise. The academic literature has chased "psychological momentum" across sports for four decades since Gilovich, Vallone and Tversky's hot-hand paper, and team-level game-to-game effects of this kind reliably shrink toward zero once quality and schedule are controlled.
What would change our mind
A real response-game effect should show up as: next-game margins after blowout losses beating the team baseline by multiple points, robust across seasons, surviving an opponent-strength adjustment, and ideally concentrated where the story says it lives (home games after road embarrassments, say). One season of data can't rule all of that out — 229 pairs per extreme bucket leaves the +0.5 estimate a standard error wide enough to hide a small true effect. What one season can say is that any such effect is small enough that you'd never notice it without a spreadsheet, which is itself a verdict on the sermon.
The bottom line
Last game's score tells you almost nothing about tonight that the standings didn't already. The 21-point swing in raw next-game win rate across our buckets compresses to a two-point sliver once each team is measured against itself, and the pair-to-pair correlation is +0.017. Teams don't bounce back and they don't spiral — they regress to what they are, one noisy game at a time. If you want to know who wins tonight, skip yesterday's margin and look at the rating gap; that number, unlike momentum, has never needed a story.
Sources & Further Reading
- Game results: bundled
data_layer/nba_home_results.csv— every game in the bundled 2023-24 log (1,231 rows: 1,230 regular-season games plus the In-Season Tournament final), built into 2,432 per-team consecutive-game pairs in date order. Buckets, baselines and the correlation computed exactly as described; chart bychart_bounce_back.py. - Gilovich, Vallone & Tversky, “The Hot Hand in Basketball” (1985) — the founding paper on momentum perception versus sequence statistics.
- Related on this site: are win streaks real or random?, how much of an NBA game is luck?, and the back-to-back penalty — the schedule effect that, unlike momentum, actually shows up.