A team rips off six straight wins and the language changes instantly: they're "rolling," "locked in," "riding momentum." The implication is that winning causes winning — that a streak is something more than the sum of its games. So I tested it. I rebuilt every team's 2023-24 season as a chronological win/loss sequence, counted every streak, and compared the result to a world with no momentum at all — one where each team's games are just weighted coin flips. The verdict: NBA win streaks are almost exactly what pure randomness and talent produce on their own. The "hot team" is mostly a story we paint onto a coin that landed heads a few times in a row.
The test: real streaks vs. a world without momentum
Here's the idea. If momentum were real — if winning genuinely made the next win more likely — we'd see more long streaks than chance allows. So I built a null model with the momentum surgically removed: each team plays the same number of games, winning each one independently with a probability equal to its actual season win rate. A 60-win team is a 73% coin; a tanking team is a 30% coin. No game knows what happened the night before. Simulate thousands of those seasons and you get the streak distribution you'd expect from talent plus luck, and nothing else. Then lay the real streaks on top.
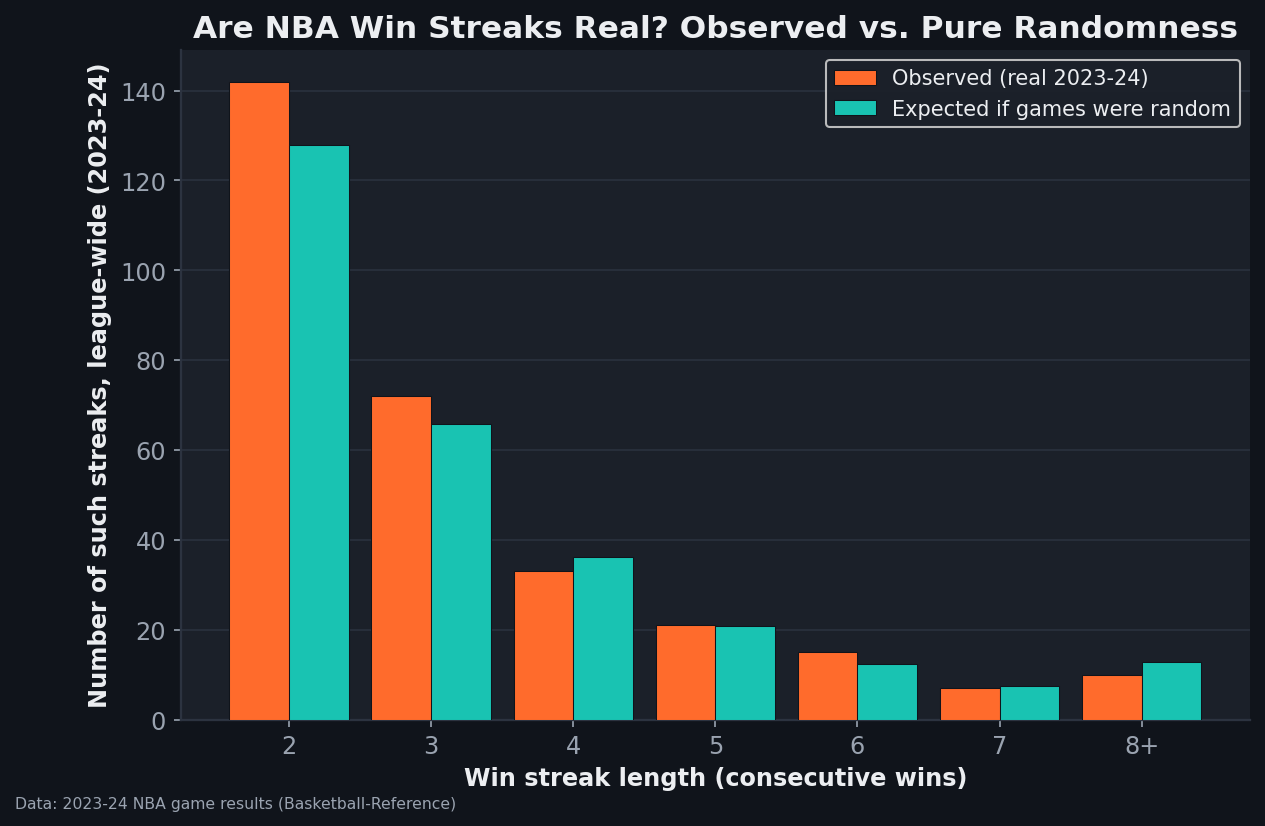
The bars barely separate. The league produced 142 two-game win streaks; randomness predicts 128. There were 72 three-game streaks against an expected 66; 21 five-game streaks against 21; and 10 streaks of eight or more against an expected 12.7. Across the whole range, the real season sits right on top of the no-momentum model. The handful of long heaters that defined the season's narrative — the runs that got teams labeled unstoppable — are, in aggregate, slightly fewer than weighted coins would have given us.
What "it's mostly random" does and doesn't mean
This is the part that gets misread, so let me be precise. "Streaks are mostly random" does not mean every team is equally likely to go on a run. It means the runs are fully explained by two things we already knew: some teams are much better than others, and basketball games have a lot of luck in them. Good teams streak more because they're good, not because a previous win deposited momentum into the next one. Strip out the talent differences (that's what setting each team's own win rate does) and there's essentially no leftover "winning begets winning" signal to find.
Put the other way: a six-game win streak by a 55-win team is not evidence of a special hot state. It's the expected occasional output of a team that wins ~67% of the time, the same way a fair-ish coin will sometimes flip six heads. The streak is real; the causal momentum we attach to it is the illusion.
The small wrinkle, honestly
Look closely and the observed bars edge just above the expected ones at the short-to-medium lengths (two through six). That tiny excess is worth naming rather than hiding. It could be a faint real effect — but it doesn't require magic momentum to explain. Schedules cluster: a team catches a soft stretch of opponents, plays several at home in a week, or faces tired teams on the second night of back-to-backs, and wins pile up for reasons that have nothing to do with a psychological hot hand. Those scheduling and matchup effects, which my coin-flip null ignores, would produce exactly this kind of mild excess of medium streaks. The momentum hypothesis predicts a fat tail of long streaks; the data shows no such tail. What little deviation exists points at the calendar, not at destiny — and it's small enough that a single season can't separate it from noise.
Why our brains insist otherwise
If the data is this clear, why is "they've got all the momentum" undefeated as a broadcast take? Because humans are pattern-detectors that badly misjudge randomness. We expect random sequences to look jagged and alternating, so when a coin — or a team — produces a clean run of heads, it reads as meaningful rather than inevitable. It's the same wiring behind the hot-hand intuition in shooting and the reason a hot start gets over-extrapolated into a clutch narrative. The streak is vivid, it has a story attached, and the dozens of un-streaky stretches that fit randomness perfectly are forgettable. We remember the run and forget the base rate.
Where this analysis has limits
- One season is a modest sample. 30 teams over 82 games is enough to show the big picture — no fat tail of long streaks — but not enough to rule out a small momentum effect with confidence. The honest claim is "no large effect," not "provably zero."
- The null uses season-long win rates. Real teams change over a year — trades, injuries, a coaching change — so a team's true win probability isn't actually constant. Some "streaks" are a genuinely improved team, which my fixed-rate coin can't represent. That's a reason real streaks could modestly exceed the null without any momentum at all.
- It's about winning streaks, not performance. This measures wins and losses, not whether a team played well. A team can win ugly six times or lose three close ones while playing great; streak-counting can't see that, which is why process metrics like net rating tell you more about the near future than a streak does.
- Scheduling isn't modeled. The coin-flip null ignores opponent quality, home/road, and rest, all of which cluster and can manufacture streaks. That's a feature for this question (it isolates "pure momentum") but means the small observed excess shouldn't be read as evidence for momentum.
The takeaway
Run the real 2023-24 season against a world with momentum deleted and you can barely tell them apart. NBA win streaks — including the long, season-defining ones — are about what you'd expect from unequal teams flipping weighted coins. Good teams streak because they're good; the extra ingredient we call momentum mostly isn't there. So the next time a team "can't lose," the useful question isn't how hot they are. It's how good they actually are — because that, plus luck, is the whole story the streaks are telling.
Reproduce it
Rebuild each team's chronological win/loss sequence from the game log, count win streaks by length, and compare to a null where each team's games are independent draws at its season win rate (4,000 simulated seasons, fixed seed). The chart is regenerated by charts/chart_streak_randomness.py against the bundled data_layer/nba_home_results.csv — no network, nothing hand-entered.
Sources & Further Reading
- Game-by-game results: bundled
data_layer/nba_home_results.csv(1,231 real 2023-24 games), analyzed bycharts/chart_streak_randomness.py. Underlying data: Basketball-Reference. - The hot-hand and randomness-perception literature traces to Gilovich, Vallone & Tversky (1985) on the "hot hand" in basketball; the framing here applies the same null-model logic to win streaks.
- Related: Three-point variance and clutch, quantified — the same signal-vs-noise problem at the shot and game level.
- Related: How often is an NBA game actually close? — another look at what the raw game results really contain.