Basketball is supposed to be the sport where the better team almost always wins — no flukey bounces, no goalie standing on his head, just talent grinding out over 48 minutes. The 2023-24 data mostly agrees, with one big asterisk: the better team won 67.9% of games across the season, but that headline hides a steep gradient. In a toss-up, the favorite barely cleared a coin flip (55%); in a true mismatch, it won four times out of five (81%). How deterministic the NBA is depends entirely on how far apart the two teams are.
How I defined "the better team"
For every game I labeled the “better team” as the one with the higher season net rating — points scored minus allowed per 100 possessions, the cleanest one-number measure of team quality. Then I took the gap between the two teams’ net ratings, bucketed every game by how big that gap was, and asked: how often did the higher-rated team actually win? That turns a vague question (“does the better team win?”) into a measurable one (“the better team wins X% of the time when it’s this much better”).
The exhibit: predictability rises with the gap
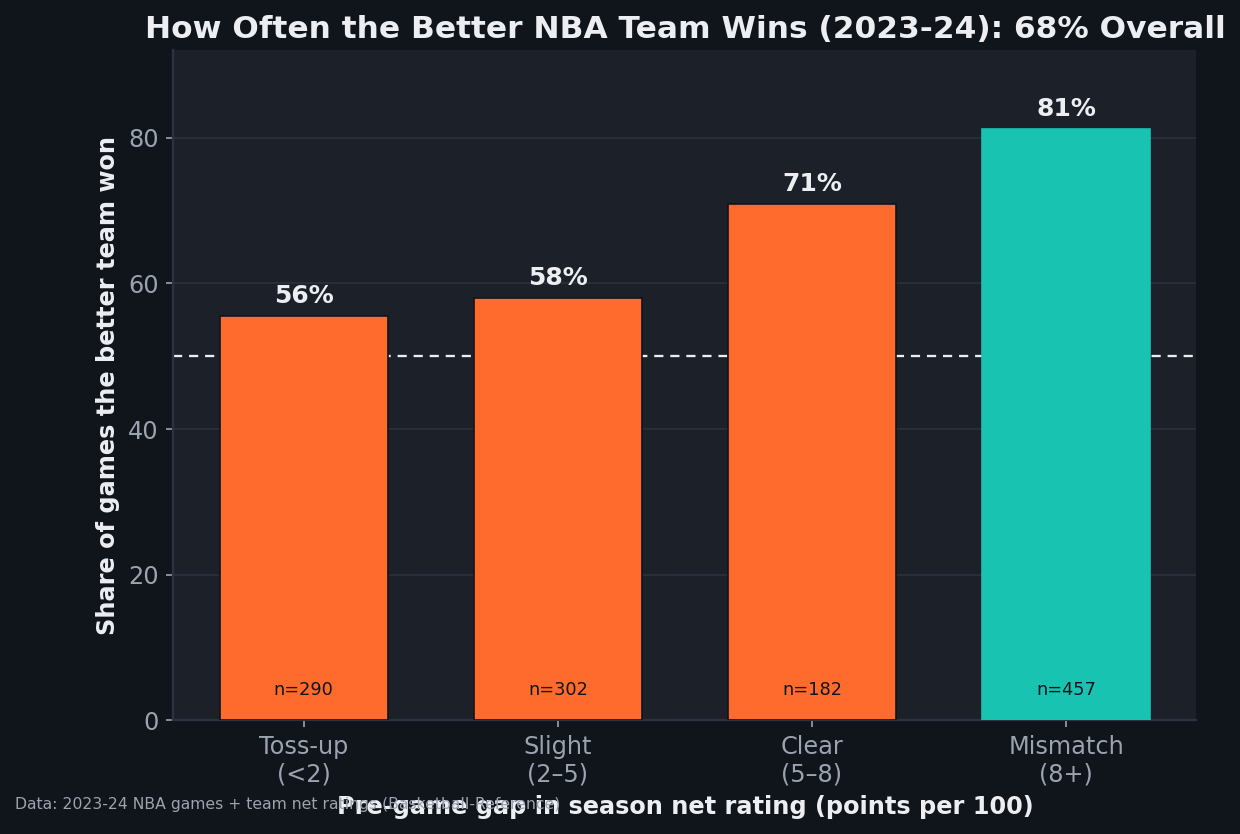
The staircase is the whole story. When two teams are within 2 points of net rating — genuinely matched — the “better” team won just 55%, barely better than chance. A slight edge (2–5) bumped it to 58%. A clear edge (5–8) jumped to 71%. And in mismatches of 8-plus points per 100 — a contender hosting a tanker — the favorite won 81% of the time. The NBA is highly predictable, but only when the teams are actually unequal; among peers, it’s nearly a coin flip.
Why 68% is high — and why it isn't higher
Compare that 67.9% to other sports and the NBA’s reputation holds up. Favorites win far more often in basketball than in, say, baseball or soccer, where a single game is dominated by variance and the better team might win 55–60% at most. Five-on-five over 100-plus possessions gives talent a lot of room to express itself; the law of large numbers works inside a single game.
So why doesn’t the better team win 80%+ across the board? Because most NBA games aren’t mismatches. The leaguewide 68% is a blend dominated by the many close-matchup games sitting near a coin flip, dragged up by the minority of blow(out)-prone mismatches. The single number is real but misleading on its own — it’s the average of a 55% world and an 81% world, and which one you’re watching depends on the marquee.
A worked example: reading a single matchup
Say the Celtics (net rating around +11 in 2023-24) host a roughly average team (net rating near 0). That’s an 11-point gap — deep into the mismatch bucket — so the model says Boston wins about 81% of the time, before you even add home court. Now put two +3 and +1 teams together: a 2-point gap, the toss-up bucket, and the “better” team is only about 55% to win. Same league, same night, wildly different certainty. This is why “the better team always wins in the NBA” is true for the Celtics-versus-cellar game and basically false for two playoff-caliber teams trading blows.
Where this read has limits
- It’s in-sample. I used full-season net ratings to label games within that same season — the ratings already “know” how the games turned out. A true pre-game forecast (using only prior information) would be a little less accurate, so treat these as upper-ish bounds on predictability, not live betting numbers.
- Net rating isn’t destiny. A season-long average smooths over injuries, trades, rest, and schedule fatigue — the team that was +11 over the year might be +3 tonight with two starters out. The gap is a strong proxy, not the exact matchup truth.
- No home court in the buckets. I labeled the favorite purely by rating, ignoring venue. Home advantage would lift the home favorite’s number and cut the road favorite’s; folding it in is the natural next step (see home-court advantage).
- One season. 1,200-odd games is plenty to see the gradient, but the exact percentages will wobble year to year; the shape — rising with the gap — is the robust part.
The takeaway
“Does the better team win?” has a satisfying NBA answer: usually — 68% of the time — and much more than usually when the teams are far apart. But the honest version replaces the single number with a gradient. The favorite is a near coin flip among equals and a near lock in a mismatch, and almost every interesting game in the league lives somewhere on that slope. Predictability isn’t a fixed property of the sport; it’s a function of how unequal tonight’s two teams happen to be.
Reproduce it
Join each game in data_layer/nba_home_results.csv to the two teams’ net ratings in data_layer/nba_ratings.csv, label the higher-rated team the favorite, bucket by the absolute rating gap, and compute the favorite’s win rate in each bucket. The chart is regenerated by charts/chart_better_team_win_rate.py — no network, nothing hand-entered.
Sources & Further Reading
- Free textbook: Chapter 25: Game Outcome Prediction — the theory behind this, at DataField.dev.
- Game results and team net ratings: bundled
data_layer/nba_home_results.csvanddata_layer/nba_ratings.csv(2023-24), joined bycharts/chart_better_team_win_rate.py. Underlying data: Basketball-Reference. - Related: Are NBA win streaks real or random? — the same talent-plus-luck framing applied to streaks.
- Related: How often is an NBA game actually close? and net rating explained — the margin and the metric behind this.