The broadcast truism says NBA scoring climbs all season — offenses “figure it out,” defenses coast, April turns into a track meet. The 2023-24 game log says the opposite. Combined scoring rose from 223.0 points a game in late October to a 234.4 peak in December, drifted down through the winter, then fell off a cliff at the All-Star break: 231.1 before the break, 223.1 after — an 8.0-point drop that sits 6.7 standard errors from zero. By March, the league was scoring less per game than it had in opening week. The season's scoring arc isn't a ramp. It's a hump, and the summit is December.
The shape of the season, month by month
The bundled log has 1,231 rows; one of them — the December 9 In-Season Tournament final, Pacers 109 at Lakers 123, played on a neutral floor in Las Vegas — is not a regular-season game and gets dropped, the same bookkeeping the season-series audit ran. That leaves exactly 1,230 games from October 24 to April 14, averaging 228.4 combined points with a standard deviation of 20.3. Here is every month:
| Month | Games | Combined PPG | Home PPG | Away PPG | Home win% | Avg margin |
|---|---|---|---|---|---|---|
| Oct 2023 | 54 | 223.0 | 111.8 | 111.2 | 51.9% | 11.2 |
| Nov | 219 | 229.6 | 116.5 | 113.1 | 58.4% | 11.6 |
| Dec | 207 | 234.4 | 118.3 | 116.1 | 57.0% | 12.4 |
| Jan 2024 | 231 | 231.4 | 117.0 | 114.4 | 57.6% | 13.0 |
| Feb | 174 | 227.9 | 114.7 | 113.2 | 50.0% | 13.3 |
| Mar | 230 | 222.6 | 111.7 | 110.8 | 47.8% | 12.9 |
| Apr | 115 | 224.3 | 113.6 | 110.7 | 55.7% | 12.9 |
Two sample-size flags on the endpoints. October is short — the season tipped on the 24th, so those 54 games are one week of basketball. And April is a stub: the season ended on the 14th, so its 115 games are two weeks. The load-bearing months — November through March — all have 174 to 231 games, and they trace a clean rise-then-fall: up 6.6 from October to November, up another 4.8 into December, then down 3.0, 3.5, and 5.4 in consecutive months. The December peak and the March trough are 11.9 points apart, 6.6 standard errors. That gap is not noise.
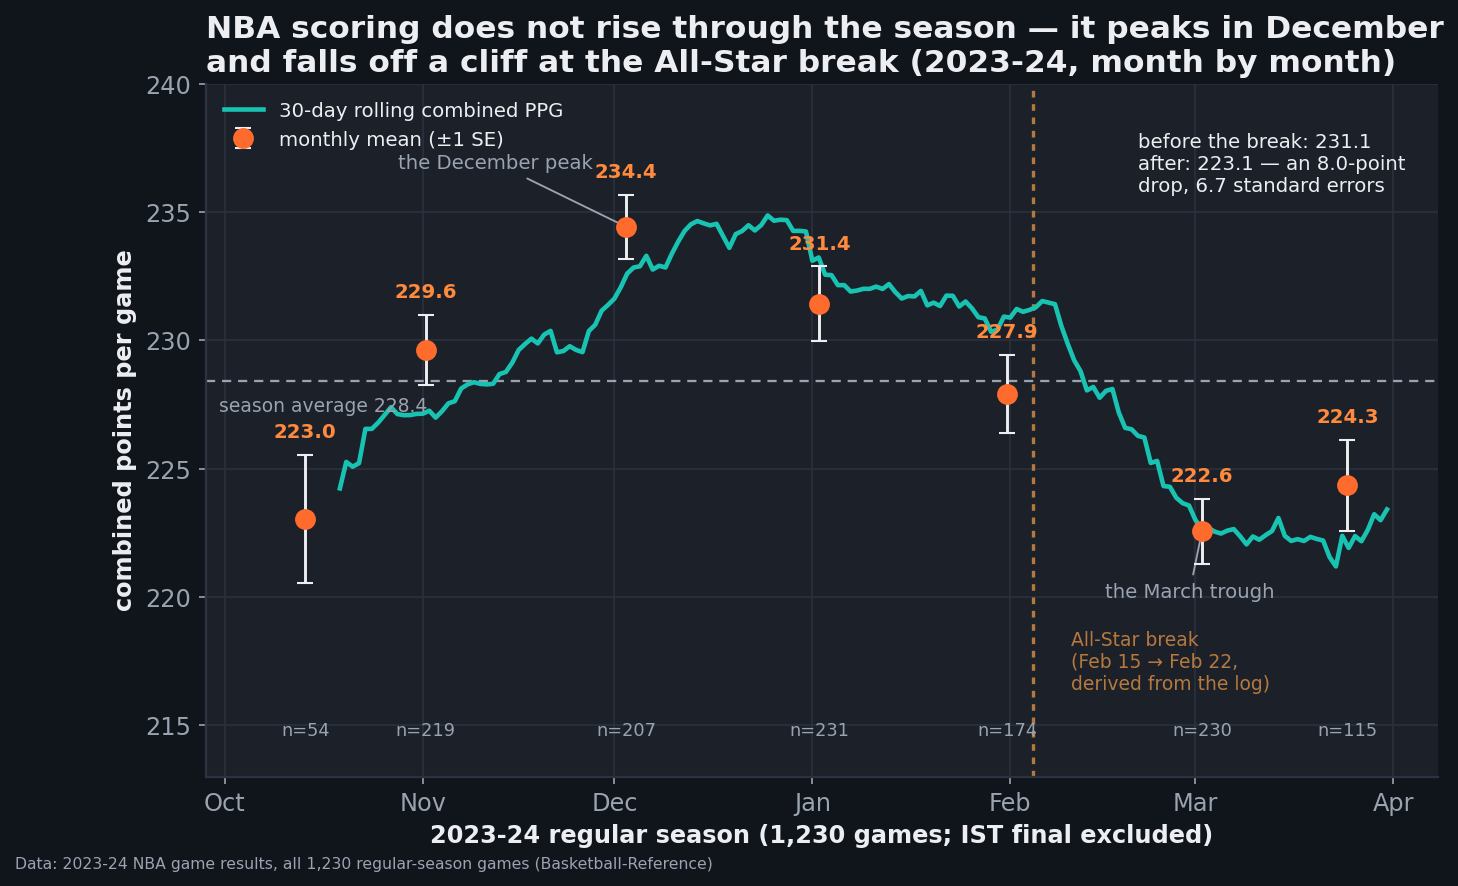
data_layer/nba_home_results.csv — 1,231 rows, with the 2023-12-09 In-Season Tournament final excluded as non-regular-season, leaving 1,230 games. Chart by chart_scoring_by_month.py.The All-Star break is the hinge
I didn't take the break date from memory; the log can tell you itself. The longest gap between consecutive game dates in February 2024 runs from February 15 to February 22 — seven days dark; no other gap in the 1,230-game calendar exceeds three. Split the 1,230 games there and the two halves barely look like the same league:
| Games | Combined PPG | Home win% | Avg margin | |
|---|---|---|---|---|
| Before the break | 820 | 231.1 (SE 0.7) | 55.9% | 12.4 |
| After the break | 410 | 223.1 (SE 0.9) | 51.2% | 13.0 |
Minus 7.97 points, standard error 1.18. And the cut is visible inside February itself: the 109 games before the break averaged 230.9; the 65 after it averaged 222.9. The month's respectable 227.9 is an average of two different leagues. Whatever changed, it changed over those seven days off — which happen to sit right next to the February 8 trade deadline, after which rosters churn, veterans get bought out, and the bottom third of the league begins managing minutes toward the lottery. The file can't separate those stories, but it puts the timestamp on the seam.
It isn't just points
The same arc runs through everything else in the table. Home-court advantage peaked in November — home teams won 58.4% of games and outscored visitors by 3.39 a night, both monthly highs — then eroded all winter and bottomed out in March at +0.93 and 47.8%: the only month of the season in which road teams won more often than home teams (February was a dead-even 50.0%). Margins tell the same story from another angle: October's games were the season's tightest at 11.2 points of average separation, February's the widest at 13.3. Blowout basketball and post-break basketball arrived together, which is what you'd expect if the late-season league is increasingly split into teams with a playoff seed to chase and teams with a draft pick to protect. The home-court piece put the season-long edge at about 2.2 points; what that average hides is that most of it was banked by New Year's.
Is the arc real, or am I reading tea leaves?
Month buckets invite overfitting, so check it three other ways. First, the boring regression: fit combined points against day-of-season across all 1,230 games and the slope is −0.049 points per day — about −1.5 points per 30 days, t = −4.4. The correlation is small (r = −0.12; day-of-season explains only about 1.5% of any single game's total, against a 20-point game-to-game standard deviation), but its sign settles the headline question: across the full season, scoring falls. Second, the rolling views: the 100-game rolling average tops out at 236.7 in the games ending December 23 and bottoms at 220.3 in the games ending March 23 — a 16.4-point swing, peak to trough, in three months. Third, count the shootouts instead of averaging: 39.1% of December games cleared 240 combined points; in March, 17.8% did. The season's highest-scoring game (Pacers 157 at Hawks 152, 309 points, November 21) and its lowest (76ers 79 at Knicks 73, 152 points, March 10) both sit exactly where the arc says they should.
The one honest hedge on the month table: no single adjacent-month step exceeds 2.7 SE on its own (and the March-to-April bounce is a mere 0.8), so any individual monthly move is arguable. The claim that survives every test is the shape — up from October to a December-January plateau, then a break-timed fall — and the break split itself, which at 6.7 SE would survive any multiple-comparisons penalty you care to charge it.
What this file can't see
- One season. This is 2023-24 only — a year whose midwinter scoring spike drew enough attention that contemporaneous coverage tied the late fade to shifting officiating emphasis. A five-column game log can neither confirm nor refute that, and one year's arc is not a law of Octobers and Marches.
- No possessions. The file has final scores, not pace. An 8-point drop could be fewer possessions, worse shooting per possession, or both — this data literally cannot distinguish them, so this article makes no efficiency claims at all.
- Small end-months. October is 54 games and April is 115; their means carry standard errors of 2.5 and 1.8. April's small bounce (+1.8 over March, 0.8 SE) is indistinguishable from nothing.
- Schedule mix isn't modeled. Rest patterns shift across the calendar — the back-to-back penalty and 3-in-4 pieces found those effects small, but nobody has audited their monthly distribution here. December also contains the IST knockout rounds (regular-season games, higher stakes), which this file counts but can't flag.
- Scoring ≠ competitiveness. Don't read the December peak as December drama: across this same file, total points and final margin are uncorrelated (r = −0.02).
Reproduce it
The whole analysis is a groupby. Ten lines:
import pandas as pd

g = pd.read_csv("data_layer/nba_home_results.csv")
g = g[~((g.date == "2023-12-09") & (g.away_team == "Indiana Pacers")
        & (g.home_team == "Los Angeles Lakers"))]   # IST final: not reg. season
assert len(g) == 1230
g["date"] = pd.to_datetime(g.date)
g["total"] = g.home_pts + g.away_pts
print(g.groupby(g.date.dt.to_period("M"))["total"].agg(["count", "mean"]))

feb = sorted(g.date[g.date.dt.month == 2].unique())
resume = max(zip(feb[1:], feb), key=lambda p: p[0] - p[1])[0]  # 2024-02-22
print(g[g.date < resume].total.mean(), g[g.date >= resume].total.mean())
# 231.08 before the break, 223.11 after
chart_scoring_by_month.py runs the full version on every build — monthly table, break split, rolling averages, trend line — and prints every number quoted above.
Sources & method
- Game-by-game results: bundled
data_layer/nba_home_results.csv— 1,231 rows covering 2023-24, of which the 2023-12-09 In-Season Tournament final (Pacers at Lakers, neutral site) is excluded as a non-regular-season game, leaving all 1,230 regular-season results. Underlying data: Basketball-Reference. - Method: combined points = home + away score; months are calendar months; the All-Star break is derived from the data as the longest gap between consecutive game dates in February 2024 (Feb 15 → Feb 22); the rolling line is a 30-calendar-day game-weighted average; uncertainties are ±1 standard error of the mean. All figures computed 2026-08-04 by
chart_scoring_by_month.py. - Limits: one season; no possession counts in the file, so pace and efficiency cannot be separated; October (54 games) and April (115 games) are partial months.
- Related on this site: do high-scoring games get closer · home-court advantage in 2023-24 · the back-to-back penalty.