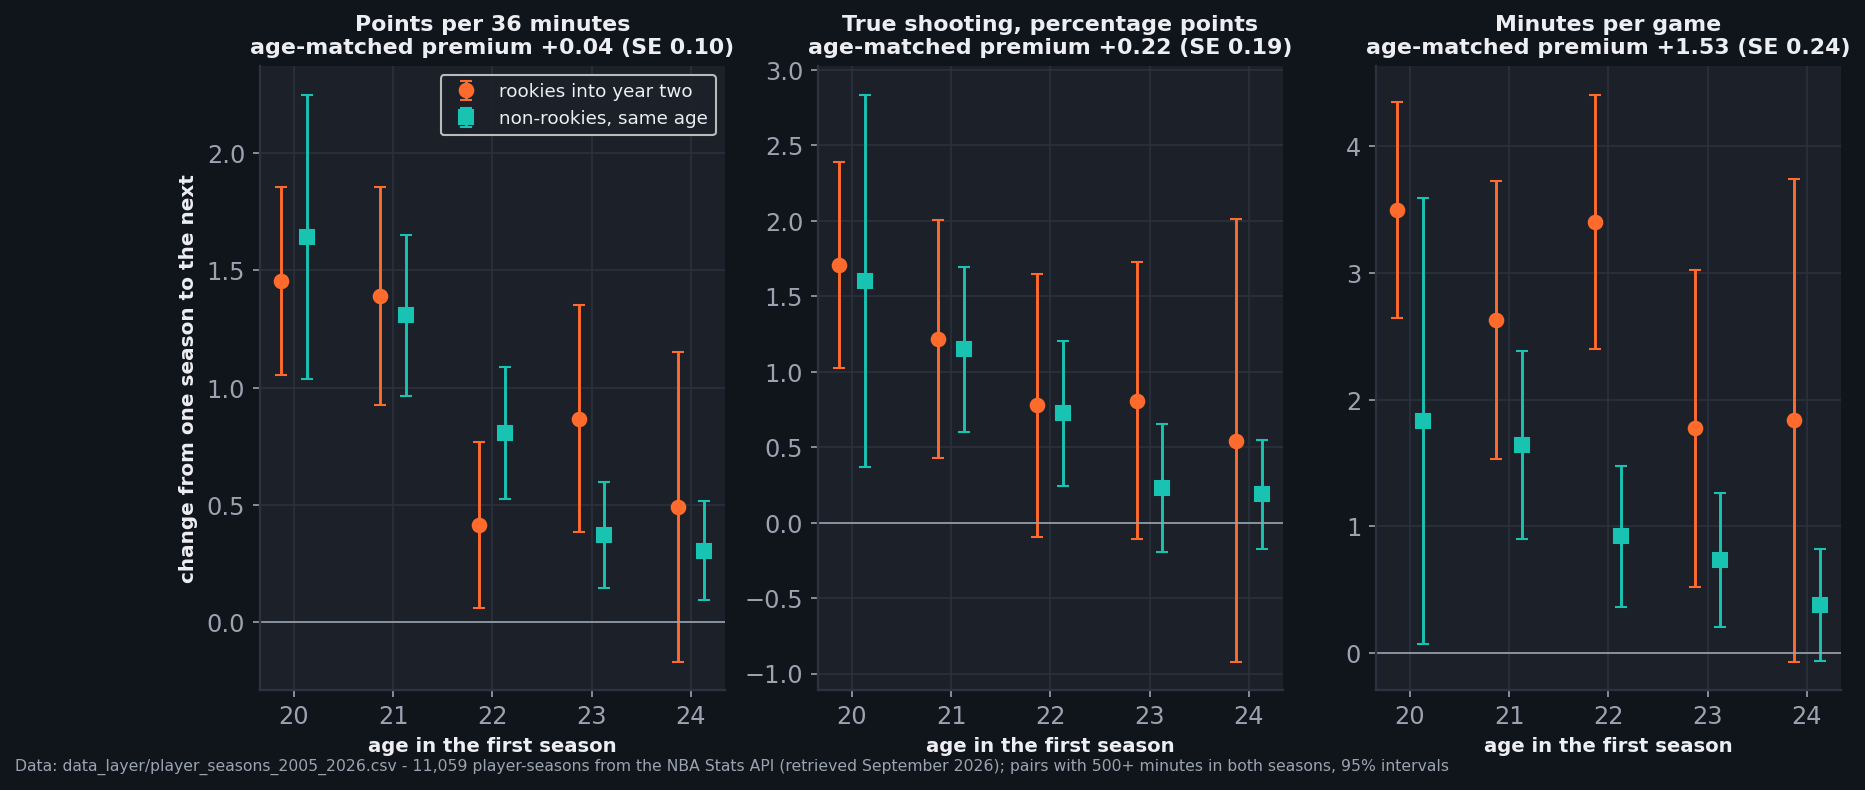
Every October someone predicts a second-year jump, and the numbers seem to back it. The 606 NBA rookies since 2004-05 who played at least 500 minutes in each of their first two seasons added 0.97 points per 36 minutes in year two and 1.10 points of true shooting. That is the sophomore leap, and it is real. It is also what every player that young does. Compare each rookie with non-rookies of the same age and the year-two premium shrinks to +0.04 points per 36 and +0.22 points of true shooting, both inside the noise. What second-year players really get is 1.53 more minutes a game than age alone would give them. The leap is a birthday and a bigger role, not a second-year skill jump.
The leap everyone sees
The file behind this article is every player-season from 2004-05 through 2025-26, 11,059 of them, pulled from the league's stats service with the league's own rookie flag attached. That flag marks 1,914 rookie seasons, and the verification script checks that none of those players appears in any earlier season of the file. A player traded mid-season appears once, with his league totals.
A fair comparison needs real minutes in both seasons, so the unit here is a pair: one player in two consecutive seasons with at least 500 minutes in each. Of the 746 rookies who reached 500 minutes, 718 played again the next season and 606 reached 500 minutes again. Those 606 are the rookie pairs. Every other player who did the same thing in some later pair of seasons, 5,252 pairs in all, is the comparison group.
| Change in | Rookies into year two (606) | Non-rookies (5,252) | Age-matched premium (569) |
|---|---|---|---|
| Minutes per game | +2.63 | -0.51 | +1.53 (SE 0.24) |
| Points per 36 | +0.97 | -0.10 | +0.04 (SE 0.10) |
| True shooting, points | +1.10 | +0.01 | +0.22 (SE 0.19) |
| Usage rate, points | +0.74 | -0.21 | 0.00 (SE 0.11) |
Read the first two columns and year two looks transformative: rookies improve on everything while everyone else stands still or slips. But 62.1% of the non-rookie pairs start at 26 or older, on the other side of the age curve. Comparing a 21-year-old with a 30-year-old measures age, not experience.
data_layer/player_seasons_2005_2026.csv (11,059 player-seasons from the league's stats service, retrieved September 2026, built by data_layer/build_player_seasons.py). Charted and verified by chart_the_sophomore_leap.py.Match the ages and it disappears
The fix is to compare like with like. For each rookie pair, take the rookie's change and subtract the average change of non-rookies who were the same age in the first season of their pair. What is left is whatever year two adds beyond being a year older.
Age-matched premium mean over rookies of [ rookie's change − mean change of non-rookies the same age ]
Age is the league's own figure for each season. Ages need at least 20 non-rookie pairs to serve as a baseline, which drops the 37 rookies who were 19. There is exactly one non-rookie pair that young, so a 19-year-old rookie has nobody to be compared with. Those 37 gained 1.17 points per 36 and 1.85 points of true shooting, but with no same-age comparison there is no way to split that between age and year two. That leaves 569 rookies.
By age the two groups track each other closely. At 20, rookies gain 1.46 points per 36 and non-rookies 1.64; at 21, 1.39 and 1.31. At 22 the rookies trail, 0.41 against 0.81; at 23 they lead, 0.87 against 0.37. On scoring neither group consistently leads. On true shooting the rookies come out slightly ahead at every age, by a tenth of a point or less from 20 to 22 (1.70 against 1.60 at 20) and by 0.58 and 0.36 at 23 and 24. Averaged across all 569, the premium is +0.04 points per 36 with a standard error of 0.10, and +0.22 points of true shooting with a standard error of 0.19: a small edge that the data cannot separate from zero. Usage rate, which measures how much of the offence a player carries, comes out at 0.00.
So young players do improve a lot, and the improvement is largest from 19 to 21 and falls away quickly after that. It barely depends on which season of a career they are in. A 21-year-old going into his third or fourth season improves about as much as a 21-year-old going into his second.
The one thing that is about year two
Minutes are different. Rookies moving into year two gain 1.53 minutes a game more than non-rookies of the same age, with a standard error of 0.24, more than six standard errors from zero. The gap shows at every age: 3.50 minutes against 1.83 at 20, 3.41 against 0.92 at 22, and 1.84 against 0.38 at 24.
That fits how teams treat a second-year player. The rookie year is an audition, and the ones who pass it get more minutes than their improvement alone would explain. The audition cuts both ways. Of the rookies with 500 minutes, 81.2% reached 500 again the next season, against 85.9% of non-rookies aged 20 to 23. Year two raises the minutes of the players teams keep and sorts out more of the ones they do not.
Does it hold up?
Every figure above is re-run in the verification script with the thresholds and splits changed:
- At 1,000 minutes in both seasons (316 rookies with an age match) the premium is -0.11 points per 36 and +0.26 points of true shooting, still nothing, and minutes are still +1.46.
- By era. Rookie cohorts from 2004-05 to 2014-15 show -0.01 points per 36, +0.37 true shooting and +1.86 minutes. Cohorts from 2015-16 to 2024-25 show +0.26, +0.11 and +0.74. The minutes premium is smaller in the recent half, with a standard error of 0.43, and the production premium is still not distinguishable from zero.
- By draft slot. The 242 lottery picks among the 606 show -0.10 points per 36, -0.23 true shooting and +1.56 minutes. The other 364, including 62 undrafted players, show +0.13, +0.49 and +1.51. Being a high pick does not buy a bigger second-year jump. It buys a bigger first-year role: lottery picks averaged 24.26 minutes a game as rookies, the others 18.62.
One caution runs the other way. Rookie efficiency regresses hard: across the 606 pairs, each point of true shooting above the rookie average carried only 0.587 of a point into year two. Of the 606, the 37 who shot 60 or better as rookies lost 1.06 points on average the next season. The average is not a promise, and a hot rookie year is the likeliest to cool. The same logic sits behind what separates a real breakout from a noisy one.
The class of 2025
The 2025-26 season had 103 rookies, and 41 of them played 500 minutes. Those 41 skew young, with three 19-year-olds and thirteen 20-year-olds, so as a group they sit on the steep part of the age curve. That is the real reason to expect them to improve. The table lists the ten who played the most, with the average change for players of the same age in the file, rookie or not. It is a baseline, not a forecast of any one player.
| Rookie | Team | Age | Pick | MPG | Pts/36 | TS% | Same-age change, pts/36 | Same-age change, TS |
|---|---|---|---|---|---|---|---|---|
| VJ Edgecombe | PHI | 20 | 3 | 35.0 | 16.5 | 54.0 | +1.50 | +1.68 |
| Kon Knueppel | CHA | 20 | 4 | 31.5 | 21.1 | 63.3 | +1.50 | +1.68 |
| Cooper Flagg | DAL | 19 | 1 | 33.5 | 22.6 | 54.8 | +1.23 | +1.97 |
| Jeremiah Fears | NOP | 19 | 7 | 25.8 | 19.9 | 52.5 | +1.23 | +1.97 |
| Derik Queen | NOP | 21 | 13 | 25.0 | 16.9 | 54.6 | +1.34 | +1.17 |
| Ace Bailey | UTA | 19 | 5 | 27.6 | 18.0 | 53.3 | +1.23 | +1.97 |
| Maxime Raynaud | SAC | 23 | 42 | 26.5 | 16.9 | 61.9 | +0.47 | +0.35 |
| Nique Clifford | SAC | 24 | 24 | 25.1 | 12.3 | 50.5 | +0.32 | +0.22 |
| Sion James | CHA | 23 | 33 | 22.5 | 8.6 | 53.1 | +0.47 | +0.35 |
| Will Riley | WAS | 20 | 21 | 22.1 | 16.8 | 54.8 | +1.50 | +1.68 |
Two things stand out. The three 19-year-olds, Flagg, Fears and Bailey, get the file's largest typical efficiency gain, +1.97 points of true shooting. That figure rests on only 38 pairs, because so few players log 500 minutes at 19. Knueppel and Raynaud shot 63.3 and 61.9, so the regression above applies to them first. The older rookies, Raynaud, Clifford and James, face same-age baselines less than half the size of the 19- and 20-year-olds'. Their second seasons will be judged against the same headline as Flagg's, and they should not be. Projection systems apply aging curves for exactly this reason.
The bottom line
The sophomore leap is real and misnamed. Second-year players do get better, by about a point per 36 minutes and a point of true shooting, but a 21-year-old in any season of his career improves by the same amount, and the age-matched premium is +0.04 and +0.22, indistinguishable from zero. What year two really changes is the job: 1.53 more minutes a game than age explains. When a second-year player looks transformed this winter, the likelier explanation is a year of age plus the playing time that came with passing his audition.
Sources & Further Reading
- Data: NBA.com/stats via nba_api: LeagueDashPlayerStats (Base and Advanced totals, every season 2004-05 to 2025-26, plus the league's Rookie filter) and DraftHistory, retrieved September 2026. Built by
data_layer/build_player_seasons.py; every number above is asserted bycharts/chart_the_sophomore_leap.py. - Definitions: true shooting = PTS / (2 × (FGA + 0.44 × FTA)); see True Shooting Percentage Explained and Usage Rate Explained.