In 2022-23, twenty of the NBA's 30 teams finished between 35 and 51 wins and nobody won 60. By the standard measure of competitive balance, it was the most even season in 27. Three seasons later eleven teams finished in that band, three won 60 or more, eight won 26 or fewer, and the same measure ranked 2025-26 the third least balanced season since 1999-00. In raw points, the spread of team margins was the widest of all 27. The story writes itself: a league splitting into contenders and teams playing for the lottery. I don't think the record supports it. Line up all 805 team-seasons and there is no trend, +0.003 on the balance ratio per decade, and seasons differ from one another no more than a league dealt out at random. What is real is that imbalance arrives in runs, and it has before: on wins, 2007-08 through 2009-10 was a tighter run than this one. A simulated league whose balance never changes, but whose teams carry their quality from one season into the next the way real teams do, produces a run at least as tight as today's in 84% of its histories. Balance doesn't trend. It swings, and the swing is made of sticky rosters.
The instrument, worked through on 2025-26
The standard measure is the Noll-Scully ratio, named for the economists Roger Noll and Gerald Scully. It asks how far the spread of winning percentages sits above the spread that luck alone would produce. If every game were a coin flip, a team's winning percentage over G games would have a standard deviation of 0.5 / √G. Divide the real standard deviation by that and you have the ratio: 1.0 is perfect parity, and everything above it is talent.
Here is 2025-26 by hand. Thirty records, from Oklahoma City's 64–18 to Washington's 17–65, average exactly .500. Their squared deviations from .500 sum to 0.82659; divided by 30 that is a variance of 0.027553, and its square root is a standard deviation of 0.16599, about 13.6 wins. A coin-flip league playing 82 games would show 0.5 / √82 = 0.05522. The ratio is 0.16599 / 0.05522 = 3.006.
The same arithmetic splits the spread in two. Luck contributes a variance of 0.25 / 82 = 0.003049, so talent contributes 0.027553 − 0.003049 = 0.024504, or 88.9% of the whole — the season-level version of the split the luck piece made for single games. Divide 0.25 by the talent variance and you get the number of games after which a record is half talent and half luck, the regression constant Tom Tango, Mitchel Lichtman and Andrew Dolphin work with in The Book: 0.25 / 0.024504 = 10.2 games.
A team that started 2025-26 at 7–3 should have been read as .500 + .200 × 10 / (10 + 10.2) = .599, a 49-win team rather than the 57 a .700 record implies. In 2022-23, when the ratio was 2.177, the constant was 21.9 games, and the same 7–3 start deserved only .563, about 46 wins. Ten games into 2025-26 a record was 49.5% talent; ten games into 2022-23, 31.3%. That is what balance changes in practice: in a lopsided season the standings tell the truth sooner, which matters more than anything October results can tell you. Across the 27 seasons the constant runs from 9.8 games (2008-09) to 21.9 (2022-23), with a median of 12.4.
data_layer/team_seasons_2000_2026.csv (805 team-seasons from the league's stats service; 2024-25 and 2025-26 records checked against Basketball-Reference). Charted and verified by chart_parity_pendulum.py — 147 asserts.Twenty-seven seasons of wins
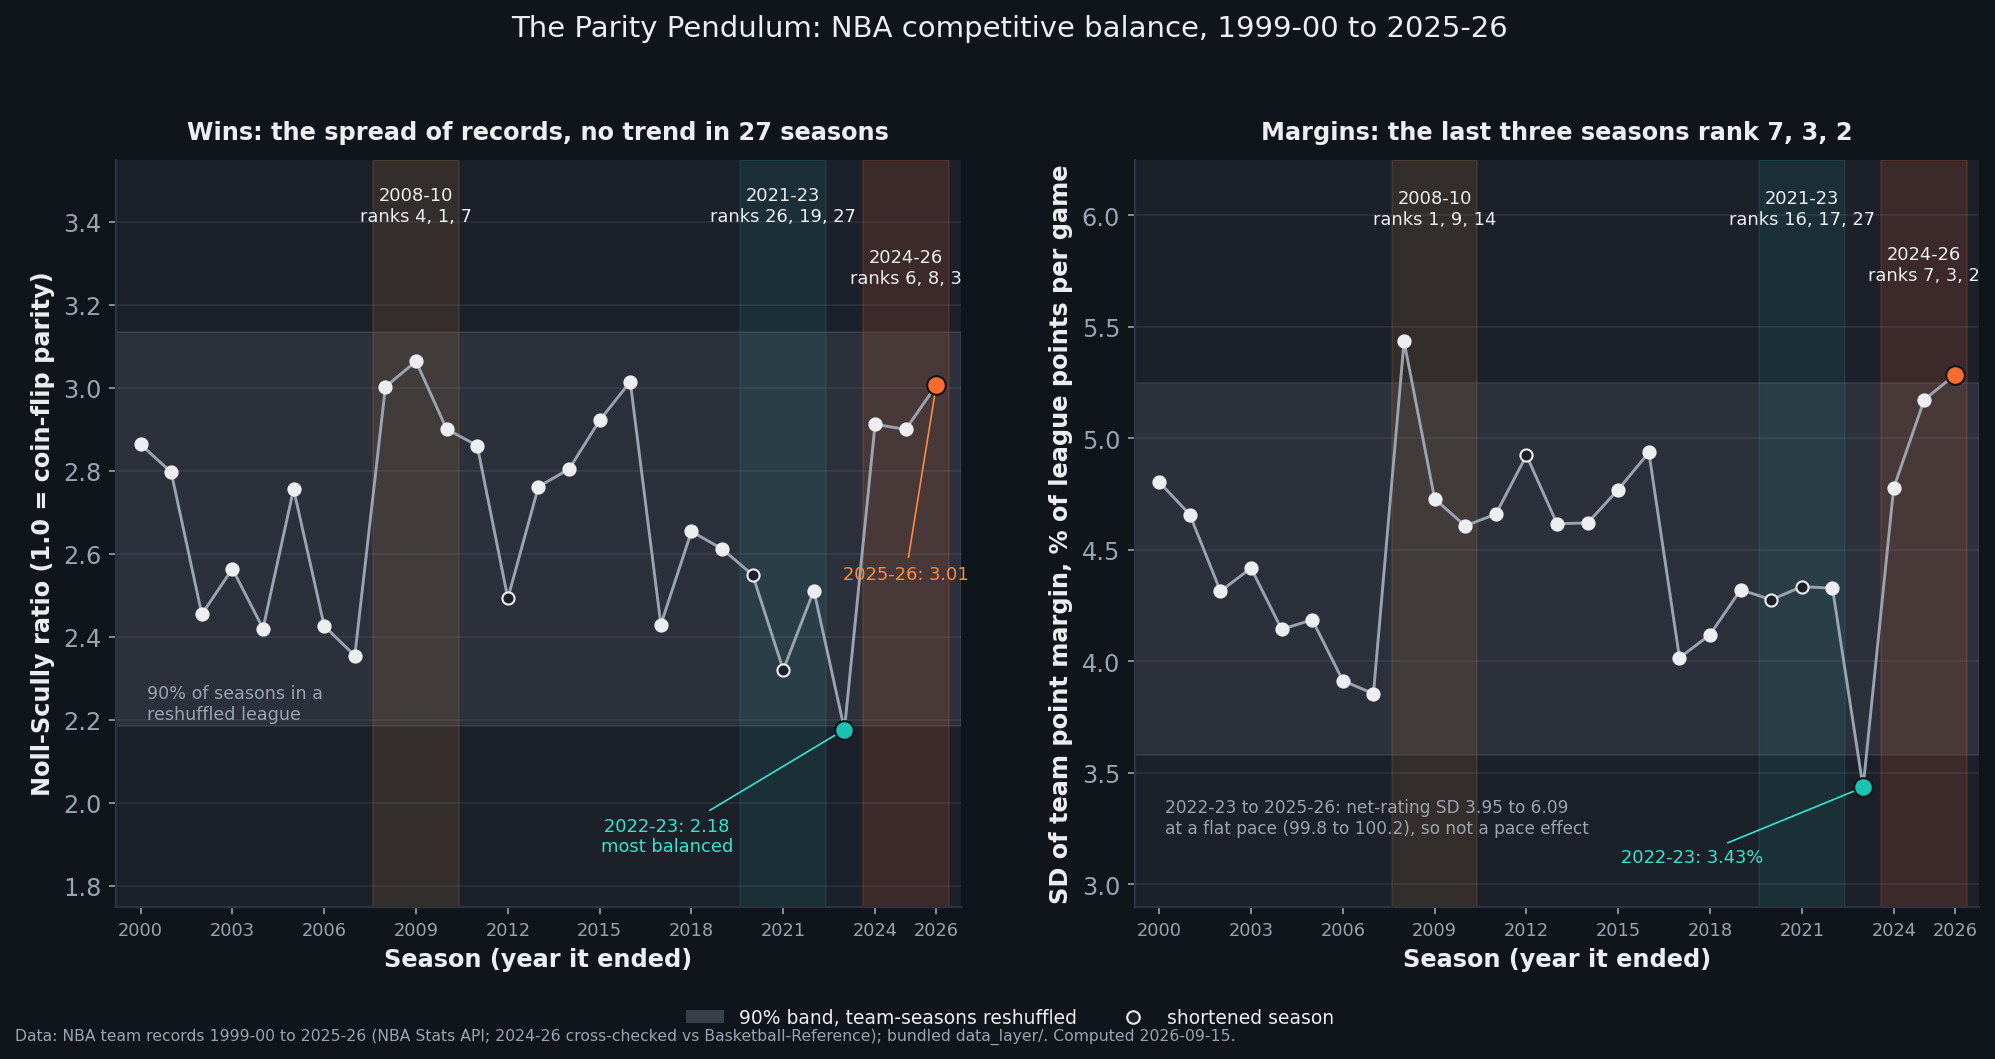
The left panel is the ratio for every season from 1999-00 to 2025-26. The average is 2.69. The least balanced season was 2008-09 at 3.064, then 2015-16 at 3.015, then 2025-26 at 3.006, a hair ahead of 2007-08's 3.002. The most balanced was 2022-23 at 2.177. Hollow dots mark the three shortened seasons, which I leave out of the reshuffle.
The question is whether any of that movement means something. I pooled the 715 team-seasons from the 24 full-length seasons and dealt them back out into seasons at random, 20,000 times. A shuffled league has no trend and no eras by construction. The grey band is where 90% of a shuffled 30-team season's ratios fall, 2.19 to 3.13. One real season in 27 falls outside it, 2022-23, and only just.
The real seasons differ from each other by a standard deviation of 0.25; shuffled ones by 0.29. A shuffled league varies at least as much as the real one 84% of the time, and produces a trend at least as steep 64% of the time. Across all 27 seasons the fitted trend is +0.003 per decade with a standard error of 0.063. A league whose balance was drifting or lurching would look more varied than a shuffled one. The NBA looks, if anything, slightly less.
The scoreboard agrees, a little louder
Winning percentage is a noisy instrument, and point margin carries less luck, which is why margin tracks wins so tightly across a season. So the right panel repeats the exercise with margins. Raw margins mislead across eras: the league scored 93.4 points a game in 2003-04 and 115.6 in 2025-26, and a higher-scoring game spreads everything. In raw points 2025-26's standard deviation of 6.11 is the widest of the 27 seasons and the last three seasons are the top three. Divide by league points per game and the picture is less dramatic: 2007-08 is the widest season at 5.4% and 2022-23 the narrowest at 3.4%, with 2025-26 second at 5.3% and the last three seasons seventh, third and second.
The recent widening is not a pace artifact. The file carries per-100-possession net ratings from 2020-21, and their spread went from 3.95 in 2022-23 to 6.09 in 2025-26 while pace moved from 99.8 to 100.2. Across all 27 seasons the two measures move together (they correlate at 0.82), and the reshuffle gives the same verdict: a shuffled league varies at least as much about seven times in ten and trends as steeply 59% of the time. Three seasons fall outside the 90% band — 2007-08 and 2025-26 above, 2022-23 below — where chance expects 2.7.
The run, and the wrong way to price it
So there is no trend. There is a run. The last three seasons rank sixth, eighth and third on wins, and seventh, third and second on margins. Ask how likely it is that three named seasons would rank that high and you get a striking answer. Of the 2,925 possible trios among 27 seasons, 23 have a margin rank sum of 12 or less, odds of 0.8%; on wins, 83 trios reach a rank sum of 17 or less, 2.8%.
That is the number that would go in a headline, and it is the wrong number, because nobody named these three seasons in advance. I noticed them. There are 25 runs of three consecutive seasons in the file, and the right question is how often some run looks this extreme. Shuffle the order of the 27 seasons 20,000 times and a three-season run at least as tight as today's shows up in 17% of orders on margins and 50% on wins. On wins, today's run is not even the tightest in the file: 2007-08 through 2009-10 ranked fourth, first and seventh.
The shuffle does find one thing it cannot reproduce. Neighbouring seasons resemble each other. The balance ratio has a season-to-season autocorrelation of 0.285, which a shuffled order reaches only 4.8% of the time (margins: 0.283, 4.5%). And the drop from the most balanced run in the file, 2020-21 through 2022-23 (ranks 26, 19 and 27), straight into today's is a 55-rank swing that a shuffled order matches 4.2% of the time. Balance has memory. The question is whether memory needs a changing league to explain it.
Where the memory comes from
It doesn't, because teams are sticky. A team's winning percentage correlates at 0.605 with its own the season before: as low as 0.261 going into 2004-05 and 0.301 into 2020-21, as high as 0.849 into 2016-17, and 0.501 into 2025-26. At 82 games a record is about 86% talent, so the underlying quality that carries over is about 0.605 / 0.861 = 0.70.
So I built a league that never changes. Thirty teams whose talent spread is fixed at the real 27-season value, a standard deviation of 0.140 in winning percentage or 11.5 wins; each team keeps 70% of last season's quality and draws the rest fresh; they play the real schedule lengths, shortened seasons included, with every game a coin weighted by quality. I ran 5,000 histories of 27 seasons. The simulated league reproduces the real carry-over (0.605) and the real autocorrelation of its balance (0.287 against 0.285, with the real value mid-distribution). It produces a three-season run at least as tight as today's in 84% of histories, one as tight as 2007-10's in 51%, and a 55-rank swing between back-to-back runs in 12%.
That is the mechanism, and it needs no villain. A spread is made of teams. My reading of the pattern is that when a handful of franchises are very good at the same time a handful are rebuilding, they stay that way for a few seasons, and the ratio reads it as a lopsided era; then the contenders age and the rebuilders arrive, and the ratio reads it as parity returning. Within a season the same bottom-heavy shape shows up as the margin creep after the trade deadline. Across seasons, the 2020-21 to 2022-23 trough and the 2023-24 to 2025-26 peak are one swing of the pendulum.
What this doesn't prove
Twenty-seven seasons is not many. The trend's 95% interval runs from about −0.12 to +0.13 per decade, so a slow drift of that size could hide in this file. "No trend" means none large enough to see, not proof that there is none.
No trend is not no cause. Lottery odds, tanking incentives, salary-cap rules and player movement all changed over these seasons. The pattern is what a league with unchanging balance would produce; that cannot show none of those forces matters, only that the standings don't need them to look like this.
The benchmark is crude. Noll-Scully compares a real league with one in which every game is a coin flip; it ignores home court, unbalanced schedules and the gap between conferences that the conference-tax piece priced at about a win. The league went from 29 to 30 teams in 2004-05, and three seasons were shortened. Scaling margins by points per game stands in for per-possession ratings, which the file carries only from 2020-21.
The model is a sketch, and I searched. The stable league assumes normally distributed talent and one persistence value for every team, when real carry-over ranged from 0.26 to 0.85. Its normal talent also makes it noisier than the real league (its balance wanders by 0.33 a season to the real 0.25, more in 95% of histories), which flatters chance on spread; the run and swing results rest on rank order, which depends on persistence rather than scale. And I ran two measures through three chance models. The p-values near .05 above are the kind a search like that turns up, which is why nothing here rests on them.
Where the recent records come from. The league's stats service, retrieved in June 2026. I checked every 2024-25 and 2025-26 record against Basketball-Reference's standings on September 15, 2026, and 2023-24 against this site's ratings and game log. All match.
Reproduce it
team_seasons_2000_2026.csv holds the 805 team-seasons, built by build_team_seasons.py from the cached league pulls. chart_parity_pendulum.py computes every season's ratio and scaled margin spread; cross-checks the file against the 2023-24 ratings and game log, the 2025-26 game log and the Basketball-Reference standings; runs 20,000 team-season reshuffles, 20,000 season-order shuffles and 5,000 stable-league histories on a fixed seed (20260915); pins each number above with an assert, 147 of them; and draws both panels. It runs offline in under a minute.
What I take from this is a warning about the next argument. When the league looks balanced, someone credits the rules; when it looks lopsided, someone blames them. Over 27 seasons neither reading has lasted, because a run of three seasons is what a 30-team league with sticky rosters produces on its own. Today's run is real and three seasons deep, and it ties the longest run of top-eight seasons in the file; no run has reached four. If 2026-27 makes it four, that would be new, and worth reading as more than the pendulum.
Sources & Further Reading
- Team records, 1999-00 to 2025-26: NBA Stats API team tables via
nba_api(retrieved June 2026), bundled asdata_layer/team_seasons_2000_2026.csvand charted and verified bychart_parity_pendulum.py. 2024-25 and 2025-26 records cross-checked against Basketball-Reference standings pages, retrieved 2026-09-15. - Scully, G. W. (1989). The Business of Major League Baseball. University of Chicago Press. One of the two economists the Noll-Scully ratio is named for.
- Tango, T. M., Lichtman, M., & Dolphin, A. (2007). The Book: Playing the Percentages in Baseball. The regression-to-the-mean constant used for the games-until-half-talent figure.
- Related on this site: how much of an NBA game is luck, the margin creep, and the conference tax.