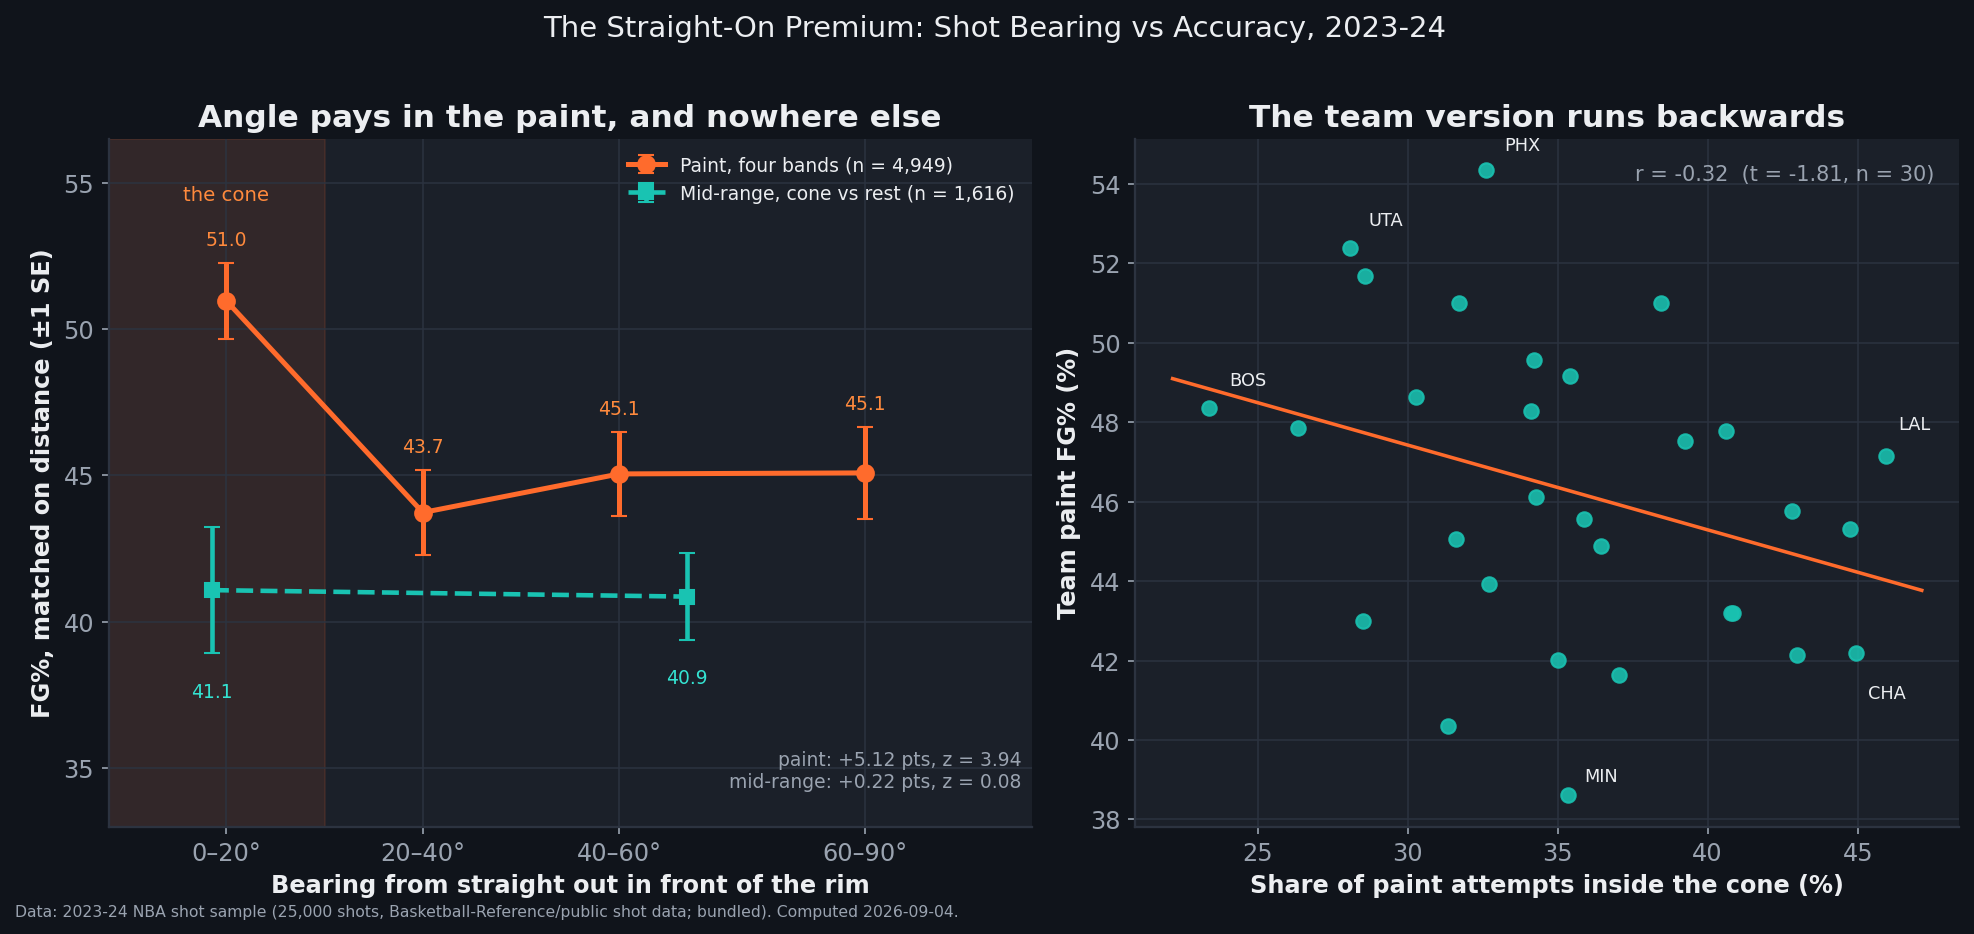
Every shot chart ever printed is drawn in rings. Distance from the rim is the axis basketball analytics settled on, and the whole modern shot-selection argument — rim, corner, arc, avoid the middle — is an argument about radius. There is a second polar coordinate, and nobody plots it. Take the 25,000-shot 2023-24 sample, give every attempt a bearing as well as a distance, and hold the distance fixed: inside the paint, a two-pointer taken within 20° of straight out in front of the rim converts 49.8% against 44.6% from the side — a +5.12-point gap at 1.30 standard errors, z = 3.94. In points per shot that is a premium of 0.102, which is larger than the corner-three premium the entire league reorganised itself around. And then the interesting part: step outside the paint and the effect is gone. In the mid-range the same comparison returns +0.22 points at a standard error of 2.62 — under a tenth of a standard error, which is as close to nothing as this file is capable of saying.
The coordinate nobody plots
The arithmetic is two lines. The file gives each shot an LOC_X and LOC_Y in feet, measured from the baseline, so with the basket centre 5.25 ft off the baseline — the same HOOP_Y convention the restricted-area piece used — every attempt has a radius and a bearing:
r = hypot(LOC_X, LOC_Y − 5.25) and θ = atan2(|LOC_X|, LOC_Y − 5.25), where θ = 0° is straight out in front of the rim and θ = 90° is level with it, out on the baseline. Left and right are folded together, because the symmetry piece already established there is nothing to find in the sign.
One guard matters more than any other result here. Under the rim, bearing is a coordinate artifact: a shot taken 0.8 ft from the basket has no meaningful angle, only rounding. So everything inside 2.75 ft is cut — 5,539 of the 15,125 two-point attempts, 36.6% of them. That is a large cut and it deserves to be stated rather than buried: those attempts convert at 70.3%, so this is not a case of quietly deleting the shots that would have embarrassed the finding. They are dunks and point-blank layups, and they are excluded because the variable does not exist for them, not because of what they do to the average. What remains is 9,586 two-pointers: 6,811 in the paint, 2,775 in the mid-range.
Then every comparison is standardised on half-foot radius bins, and a bin only counts if both sides carry at least 25 attempts. Nothing in this article compares a shot at four feet to a shot at eight. The 20° cone is narrower than it sounds: it is 1.09 ft either side of the centre line at three feet, 1.82 ft at five, 2.91 ft at eight. It is the middle of the lane, and it holds 35.5% of the paint's attempts.
data_layer/nba_league_shots.csv (25,000 real 2023-24 shots). Charted and verified by chart_shot_angle.py — 127 asserts.A step, not a gradient
The shape of the effect is the part we did not expect. If bearing worked like distance you would see a slope — accuracy bleeding away foot by foot as you walk around the rim, the way accuracy bleeds away with range. It does not. On the eleven radius bins that support all four bands at once, the paint reads 50.96% / 43.73% / 45.05% / 45.09% from the cone out to the baseline. The cone beats the next band by +7.23 points (z = 3.69) and then everything stops: the three off-axis bands span 1.35 points between them, less than any single standard error on the ladder, and the 20–40° band and the 60–90° band differ by −1.35 at 0.63 SE. A shot from 35° and a shot from 80° are the same shot. There is a cone, and there is everything else.
It holds in both halves of the paint independently, which is the check that would have killed it. Inside the restricted area alone: 57.73% against 50.28%, +7.45 at 2.78 SE. In the non-restricted paint: 46.78% against 42.52%, +4.25 at 2.88 SE. Fit a plain line through the matched paint instead of binning — accuracy on radius plus a cone dummy — and the model prices the cone at +4.76 points (SE 1.29, z = 3.68) with the distance term at −0.79 points per foot. Two different estimators, one answer.
The five-foot ring, worked through
Take one bin end to end. At 4.75 to 5.25 feet from the rim the sample holds 426 attempts. Inside the cone: 61 made of 127, 48.03%. Outside it: 117 of 299, 39.13%. That is a raw gap of +8.90 points between two groups of shots taken from the same distance, in the same season, in the same zone of the floor — differing only in where the shooter was standing when he let it go. That ring carries 6.25% of the paint's weight; the headline number is the same calculation run across 23 rings and weighted by how many shots each one holds.
Priced properly: matched on distance, the cone shot is worth 0.995 points and the off-axis shot 0.893. The site's own zone ledger puts the corner three at 1.158 points per shot and the above-the-break three at 1.081 — a corner premium of 0.077. The angle premium inside the paint is 0.102, and it is thirty years less famous.
Why the mid-range refuses to play
The two-regime result is what makes this more than a curiosity. Run the identical procedure on the 2,775 mid-range attempts and the answer is 41.08% inside the cone, 40.86% outside — +0.22 points at a standard error of 2.62. That is not a weak effect; it is an absence. And it is consistent with what this site has already measured out at the arc, where the wing-versus-top piece found wings beating the top of the key by 1.75 points at 1.3 SE once distance was matched, and the corner three turned out to be a distance discount rather than a geometry bonus. Walk around the three-point line and accuracy barely notices. Walk around the rim and it falls off a shelf.
Why the paint and only the paint? We cannot identify the mechanism from this file, and we want to be exact about that, because the plausible explanations are not distinguishable here. The one we find most likely is that bearing in the paint is a proxy for the kind of shot available from that spot. A straight-on eight-footer is usually a shooter facing the rim after a drive down the middle. An eight-footer from 70° is a baseline turnaround, a hook, a reverse, a shot taken by a body that could not square up. The file has no play type, no defender distance and no assist flag, so "angle" and "the shot family that lives at that angle" are the same column here. Beyond about fifteen feet nobody is shooting hooks and reverses at all, which would be exactly why the effect dies there.
The physics disagrees, which is worth sitting with
There is a real primary source on this question and it predicts the opposite ordering. Silverberg, Tran and Adams, in "Optimal Targets for the Bank Shot in Men's Basketball" (Journal of Quantitative Analysis in Sports 7(1), 2011, doi:10.2202/1559-0410.1299), ran over a million three-dimensional trajectory simulations and concluded that the bank shot can be as much as 20% more effective than the direct shot at many angles inside roughly twelve feet, and that the advantage is largest from the wing areas — while straight-on shots beyond twelve feet are poorly suited to the backboard. In other words, the positions where a shooter has the biggest available geometric edge are precisely the positions where this sample says he converts worst. Both things can be true: the board is there and the edge is real, and it is swamped by whatever else is happening to a player shooting off-balance from the side with help arriving. But it is a genuine tension and we would rather print it than pretend the physics is on our side.
The team version runs backwards
Here is the caveat that should stop anyone treating this as advice. Aggregate to teams — each club's share of paint attempts taken inside the cone against its paint accuracy — and the correlation is −0.324 (t = −1.81, n = 30). The wrong sign. The Lakers took the largest share of straight-on paint shots in the sample, 45.9%, and finished 47.15%. Charlotte was second at 45.0% and finished 42.20%. The champion Celtics took the smallest share of all, 23.4%, and finished 48.37%. The best paint-finishing team in the sample was Phoenix at 54.35%, on a below-average 32.6% cone share.
This is not a contradiction, it is the ecological fallacy doing its job. The per-shot effect is a within-distance comparison; the team number is a between-roster comparison, and rosters differ by far more than bearing. It also has an obvious reading: a straight-on paint shot is often the shot you take when the defence has walled off everything else and you have driven into the middle because there was nowhere else to go. Teams that generate a lot of them may be teams with one way in. The finding is real per shot and useless as a team target, and we would treat any coach who responded to it by ordering more middle drives as having read half the article.
What this doesn't prove
Five honest limits. First, and largest: the within-player check does not confirm it. Restrict to the 66 shooters with at least ten matched paint attempts on each side and the premium is +3.09 points, SE 1.92, z = 1.61, with 36 of the 66 better inside the cone. That keeps the sign and about three-fifths of the size, and settles nothing — 66 players is not enough power to separate a real shooting effect from a sorting effect in which the players who take straight-on shots are simply the players who finish. Second, the size depends on where you put the rim: at an assumed hoop centre of 5.00 ft the premium is +5.49 (z = 4.39), at 6.00 ft it is +3.10 (z = 2.16). It is positive and clears two standard errors at every plausible position, but "about five points" should be read as "three to five and a half". Third, the profile misbehaves at the extreme baseline: the 288 attempts past 80° — 75 of them from behind the rim's own line — drift upward, and the apparent recovery is +1.92 at 0.93 SE, which is nothing. We looked at it, it is not there, and we are naming it because a reader plotting this themselves will see the same bump. Fourth, one season and a sampled eighth of it; the bearing is where the shot was released, not where the play started. Fifth, the mechanism is unidentified, as above — this measures a location, not a skill.
Reproduce it
Everything above is arithmetic over one bundled file. The build-side script that draws the exhibit, chart_shot_angle.py, recomputes every number in this article from that file and pins each with an assert — 127 of them, including the whole published zone ledger, so the restricted area still reads 65.77% on 7,379 attempts, the corner three 38.59% on 2,563, and the mid-range 0.818 points per shot, exactly as the zone map printed them. If the article and the data diverge, the script fails loudly. The bearing calculation is four lines and anyone who has followed the shot-chart tutorial already has the coordinates loaded.
The lasting point is not the five points. It is that the profession spent twenty years optimising one polar coordinate and never checked the other one. Radius got the revolution — the corner, the arc, the dead long two — and it deserved it. But the shot chart is a picture of a plane, and we have been reading it as a picture of a line. Inside the paint, where four in five two-pointers are taken, the second coordinate is worth more per shot than the corner three, and it does not appear on any chart we have seen. Somebody with tracking data, defender distances and play types should go find out whether it is geometry, body position, or just the shot you settle for.