The site’s explainer on the corner three made the standard argument from geometry: the line is 22 feet in the corners against 23 feet 9 inches up top, so the shortest three should be the best three. That piece owed its readers a bill of goods — the actual percentages. This is the payment. We ran the 25,000 shot-level records bundled in the data layer and measured the corner three's premium directly: 38.6% against 36.0% for above-the-break threes, worth 1.16 points per shot against 1.08. The premium is real. But the more interesting result is what happens when you price it: fit above-the-break accuracy to distance, extend the line down to corner range, and it predicts 38.7%. The corners shot 38.6%. In this sample, the corner three carries no magic beyond its address. It is a discount created by the rulebook and collected by whoever stands in the right spot.
The ledger
The bundled file tags every attempt with a zone, an outcome, and a distance, so the accounting is one groupby. Backcourt heaves excluded (53 shots), here is the three-point ledger, with the mid-range included as the shot the corner three replaced:
| Shot | Attempts | FG% | Points per shot |
|---|---|---|---|
| Corner three (both corners) | 2,563 | 38.6% | 1.16 |
| — left corner | 1,310 | 38.9% | 1.17 |
| — right corner | 1,253 | 38.2% | 1.15 |
| Above-the-break three (all) | 7,255 | 36.0% | 1.08 |
| — from 30+ feet | 195 | 24.1% | 0.72 |
| — 29 feet and in | 7,060 | 36.4% | 1.09 |
| Mid-range two | 2,779 | 40.9% | 0.82 |
Three things in that table do the article's work. First, the raw premium: corners out-shoot the full above-the-break group by 2.6 percentage points (standard error 1.1, so about 2.3 SE from zero — real, not enormous). Second, part of that headline number is an accounting artifact. The above-the-break bucket includes 195 attempts from 30 feet and beyond that dropped at 24.1%; those are mostly end-of-clock desperation, and no defense chooses to concede them. Trim the comparison to threes from 29 feet and in and the honest premium is 2.2 points (36.4% against 38.6%), right at 2.0 SE. Third, the inversion that makes shot economics counterintuitive: the mid-range two was the most accurate jump shot in the file at 40.9% and still the worst-paying, because 2 × 0.409 = 0.82 while 3 × 0.386 = 1.16. Accuracy is not value. We walked through that inversion zone by zone in where the NBA actually shoots from; here it is the baseline fact the rest of this piece prices.
Where the premium comes from
The standard story says the corner three is better because it is closer. That is a testable claim, not a slogan, and the file has everything needed to test it. Above-the-break threes span 24 to 29 feet in volume; corner threes cluster at 22–23 feet (mean 22.9, on integer-rounded distances). So: compute above-the-break FG% at each foot of distance, fit a line, and extend it down into corner range. If the corner is just a closer three, the corners should land on the line. If corner shots are easier beyond their distance — the wide-open, catch-and-shoot story — they should sit above it.
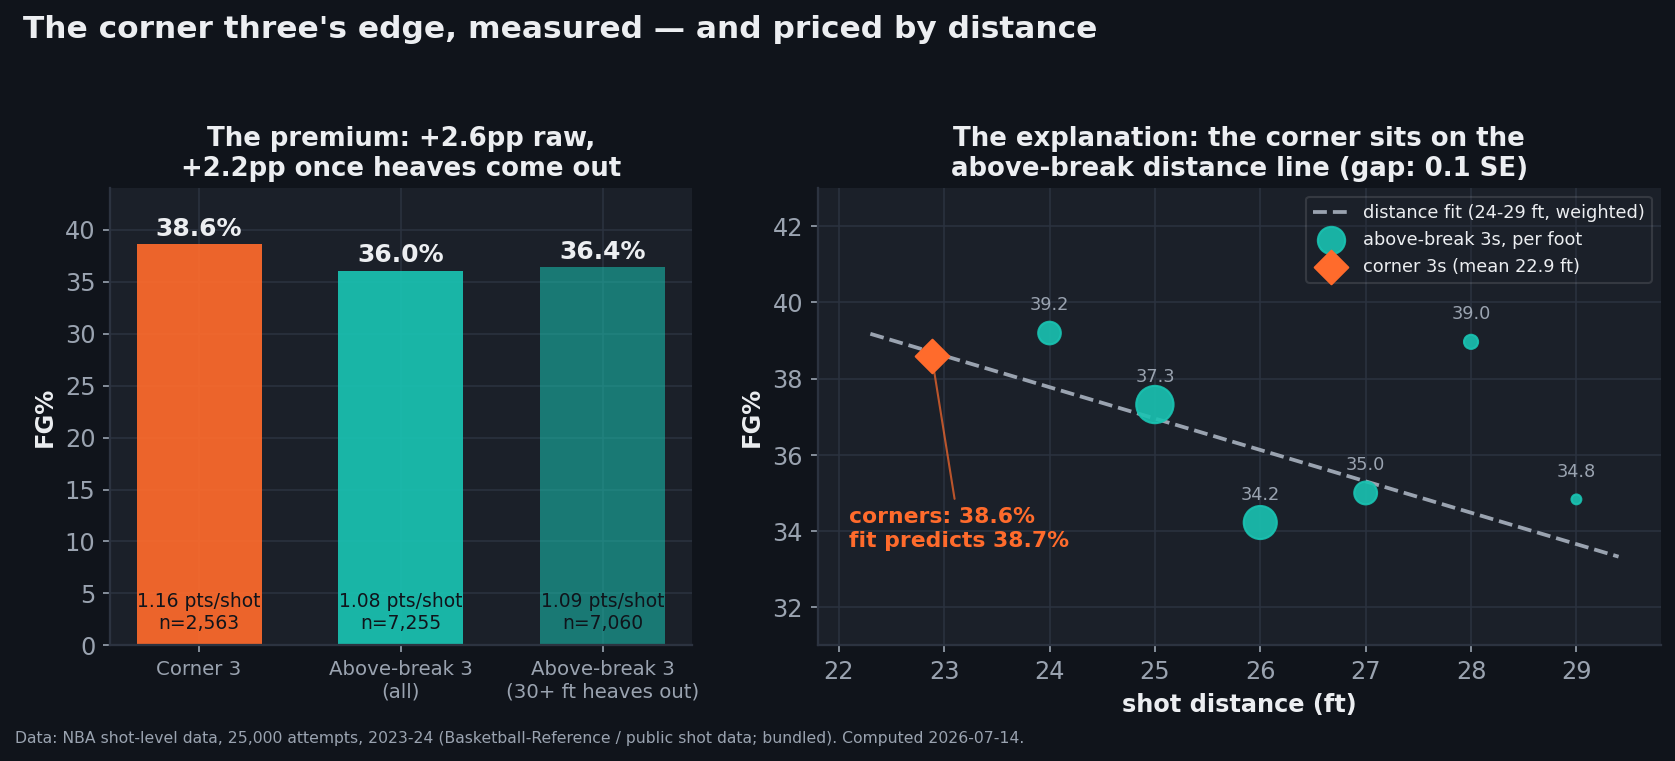
data_layer/nba_league_shots.csv (25,000 attempts, 2023-24; Basketball-Reference / public shot data). Charted by chart_corner_three.py with a stamped provenance footer.They land on the line. The attempt-weighted fit over 24–29 feet loses 0.82 percentage points per foot; evaluated at the corners' mean distance of 22.9 feet it predicts 38.7%, and the corners actually shot 38.59%. The gap is 0.11 percentage points — about one-tenth of a standard error. Another way to see the same thing without any fitting: the nearest above-the-break shots in the file, from 24 feet, went in at 39.2%, statistically level with the corners. Distance, not location, is carrying the premium.
Two honest wrinkles before anyone over-reads that. The per-foot points wobble — 28-footers hit 39.0% in this file, above the trend on 367 attempts, which is the kind of thing 367 attempts will do — so the fit is a trend through noisy dots, not a law. And "the corner sits on the line" does not disprove the famous assist story, the claim that corner threes convert well partly because they are catch-and-shoot passes rather than pull-ups. This file carries no assist flag, no defender distance, no shot clock — we cannot separate shot quality from shot creation here, and the above-the-break curve itself blends pull-ups and catch-and-shoot attempts at every distance. What we can say is narrower and still useful: whatever mix of creation effects exists, it nets out to a corner three that behaves like an ordinary three moved two-and-a-half feet closer. There is no detectable bonus on top of the geometry.
What the discount is worth
Now the economics, worked end to end. Points per shot is value times make rate. Per 100 attempts, the corner three returned 116 points in this sample, the above-the-break three 108 (109 with heaves trimmed), the mid-range two 82. So the corner-versus-above-the-break premium is worth about 7 or 8 points per 100 attempts — meaningful at the margin, and roughly the same size as the edge a good shooting night provides. The corner-versus-mid-range gap is a different animal: 34 points per 100 attempts, the single largest arbitrage between jump shots on the floor.
Scale that to a season. Take a team that moves three mid-range attempts per game into corner threes and convert at this sample's league rates: 246 attempts over 82 games, at 0.82 points per shot before and 1.16 after, is a swing of about 84 points, or 1.02 per game. A point of scoring margin per game is roughly a point of net rating at NBA pace, and the regression we ran in net rating to wins prices a point of net rating at about 2.3 wins. Three shots a game, relocated, is worth on the order of two extra wins — without anyone shooting better.
The catch is supply, and it is the reason the arbitrage has not already been traded away to zero. Corners are 10.3% of all attempts in this file and 26.1% of all threes, and the constraint is structural: the corner is two small patches of floor where a shooter cannot self-create — the shot arrives via a pass or it does not arrive. Our earlier piece covers the machinery offenses run to manufacture those passes. The worked example above assumes the three extra corner looks exist at league-average quality, and that assumption is exactly what a defense is paid to deny. Treat the two wins as the value of the discount when you can collect it, not a lever anyone can simply pull.
What about left corner versus right?
Asked and answered on this site already: the floor has no grain. Left corner 38.9%, right corner 38.2% — a 0.7-point gap at 0.4 standard errors, which is nothing. Both corners carry the same distance discount because both corners are the same distance. The value story in this piece is side-blind.
Limitations
This is one season (2023-24) and a bundled 25,000-shot sample of it, not the league's full attempt log, so every figure above carries the standard errors we quoted — the heave-trimmed premium sits at 2.0 SE, solid but not overwhelming. Distances are integer feet, which smears the corner mean. The fit is linear over a six-foot window; we would not extrapolate it anywhere we did not. There is no assist, defender, or shot-clock context, so the creation question stays open. And nothing here says a specific player should shoot more corner threes — these are league aggregates over hundreds of shooters, the same caveat that applies to any shot-diet reading.
Reproducibility
Every number above is a groupby and one polyfit over the bundled file:
import pandas as pd, numpy as np
df = pd.read_csv("data_layer/nba_league_shots.csv")
df = df[df.BASIC_ZONE != "Backcourt"]
df["pts"] = np.where(df.SHOT_TYPE == "3PT Field Goal", 3, 2) * df.SHOT_MADE

zone = df.groupby("BASIC_ZONE").agg(n=("pts", "size"),
                                    fg=("SHOT_MADE", "mean"),
                                    pps=("pts", "mean"))

atb = df[(df.BASIC_ZONE == "Above the Break 3") &
         df.SHOT_DISTANCE.between(24, 29)]
slope, icept = np.polyfit(atb.SHOT_DISTANCE, atb.SHOT_MADE.astype(float), 1)
corner = df[df.BASIC_ZONE.isin(["Left Corner 3", "Right Corner 3"])]
pred = slope * corner.SHOT_DISTANCE.mean() + icept   # 0.387 vs actual 0.386
Sources & method
- Shot-level data: 25,000 records with zone, distance, and outcome, bundled at
data_layer/nba_league_shots.csv(public shot data; sourcing notes indata_layer/SOURCE.txt). All figures computed 2026-07-14; the chart ischart_corner_three.py. - Standard errors: binomial — √(p₁q₁/n₁ + p₂q₂/n₂) for FG% differences. The distance fit is attempt-weighted least squares on shot-level rows, 24–29 ft.
- Court dimensions (22 ft corners, 23 ft 9 in arc): official NBA Rulebook.
- Related on this site: the corner three, explained · where the NBA actually shoots from · accuracy falls with distance · eFG% rose from shot mix.