There is a comfortable piece of basketball folk wisdom that says shootouts are close and slugfests are blowouts — that when both teams are scoring, the game stays tense, and when the offense dries up, someone runs away with it. We took all 1,231 games from the 2023-24 season and tested it directly against the final margins. The folk wisdom is wrong, and not by a little. The total points scored in an NBA game tell you almost nothing about how close it will be. The correlation is basically zero.
The claim we wanted to check
The intuition has a logic to it. High-scoring games feel like both offenses are humming, so surely the score stays tight; low-scoring games feel like grinds where one team's cold spell becomes a 15-0 run and a runaway. If that were true, you would expect the combined point total of a game to predict its final margin — more total points, closer game. It is the kind of thing everyone half-believes and nobody checks. So we checked.
The setup is simple: for every game, add the two final scores to get the total, and take the absolute difference to get the margin. Then ask whether the total predicts the margin. Across 1,231 games the average total was 228.4 points and the average margin was 12.6 points. The correlation between them is −0.02. That is not a weak relationship. That is no relationship.
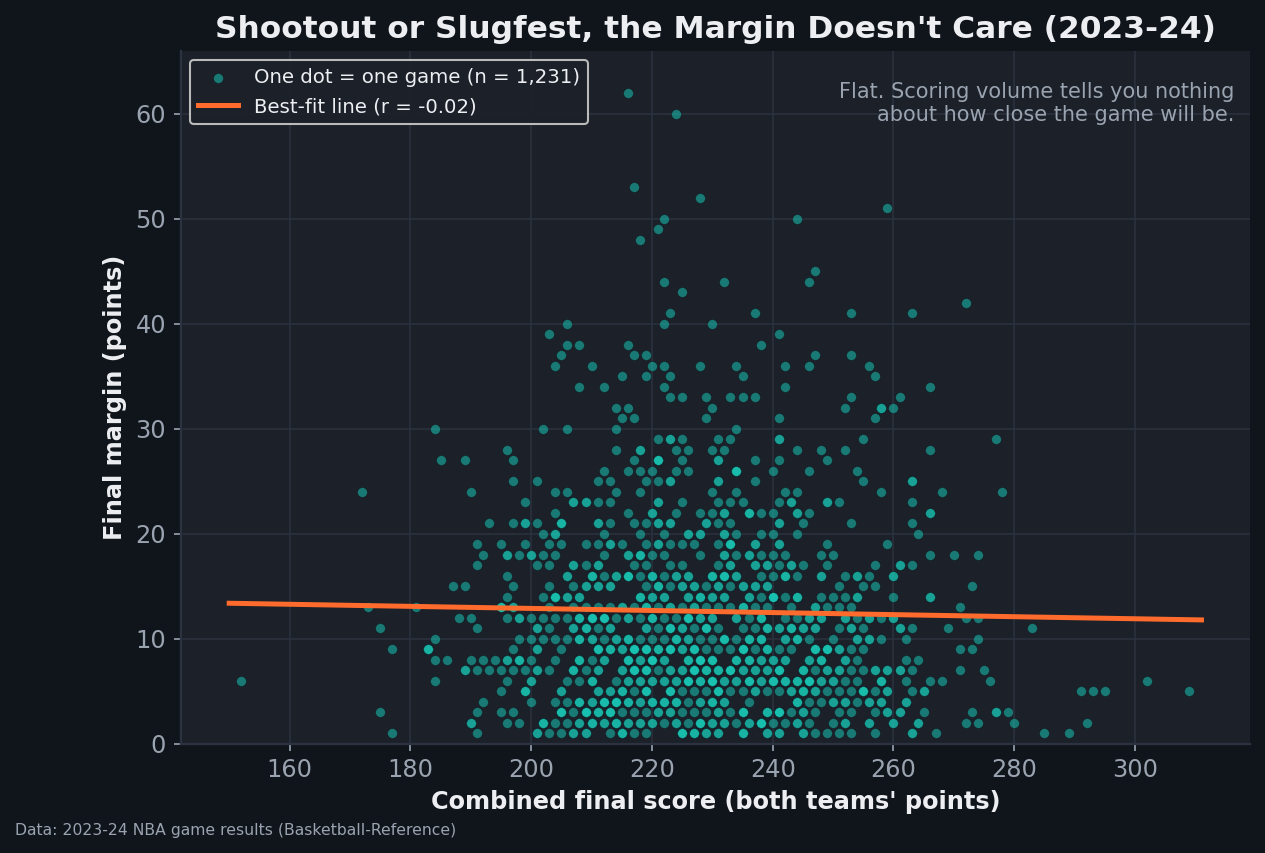
data_layer/nba_home_results.csv (2023-24; Basketball-Reference), totals and margins from final scores. Charted by chart_total_vs_margin.py with a stamped provenance footer.The exhibit: sort games by scoring, and the margin barely moves
A correlation near zero can still hide a curve, so we split the season into four equal groups by total points — the lowest-scoring quarter of games up to the highest — and looked at the average margin in each. If the folk wisdom held, the margin would slide down as scoring climbed. It doesn't. It just sits there.
| Scoring group | Games | Avg total pts | Avg margin | Close (≤5) | Blowout (≥15) |
|---|---|---|---|---|---|
| Lowest quarter | 310 | 203.7 | 11.9 | 25% | 32% |
| Second quarter | 332 | 221.6 | 13.5 | 20% | 33% |
| Third quarter | 297 | 235.3 | 12.9 | 20% | 37% |
| Highest quarter | 292 | 255.5 | 11.9 | 29% | 27% |
Source: bundled data_layer/nba_home_results.csv, all 1,231 games of 2023-24. Total = home + away points; margin = absolute point difference. Games split into four equal-size groups by total points; "close" and "blowout" are the share of games in each group decided by 5 or fewer, and 15 or more, respectively.
Look down the average-margin column: 11.9, 13.5, 12.9, 11.9. The lowest-scoring quarter of the season and the highest-scoring quarter produced identical average margins, to the decimal. The 292 highest-scoring games of the year — the 250-plus-point track meets everyone thinks of as nail-biters — were decided by 11.9 points on average, the same as the 203-point rock fights. If anything, the very highest-scoring group had the largest share of close games (29%) and the smallest share of blowouts (27%), a faint tilt in the exact opposite direction of the folk wisdom, but the effect is small enough that we would not stake anything on it.
Why the intuition fails
The reason is almost obvious once you see the numbers, and it comes down to what a margin actually is. The final margin is the difference between two teams' scoring, and the total is the sum. Those two quantities are close to independent. A game can be high-scoring because both teams are efficient and in rhythm — in which case they cancel and the margin stays modest — or high-scoring because one team is torching a defense that has stopped competing, which produces a blowout. Low totals split the same way: a defensive classic where neither team can pull ahead, or a mutual brick-fest where one team's slightly-less-awful night is enough for a 20-point win. Every scoring environment contains both close games and blowouts, in roughly the same proportions.
Pace makes this even cleaner. A lot of the variation in total points is just tempo — a fast team playing a fast team racks up a big combined score without either side being better than the other. Pace inflates the total and leaves the margin untouched, which is one more reason the two don't move together. It is the same lesson that runs through how much of an NBA game is luck: a single game's outcome is dominated by noise, and the scoreboard's total is not a lever on that noise.
The extremes agree
If the relationship were real but faint, the tails would show it — the very highest and lowest totals would part ways. They don't. The 185 games that broke 250 combined points had an average margin of 11.8. The 211 games that stayed under 210 had an average margin of 12.2. Four-tenths of a point of difference across the two extremes of the entire season is, for practical purposes, nothing. Whatever makes an NBA game close, it is not the amount of scoring in it.
What actually makes a game close
If not scoring volume, then what? Mostly the gap in team quality, and then luck. The better team wins more of the time and by more, as we laid out in how often the better team wins — a mismatch produces a blowout at any tempo, and two evenly matched teams produce a coin flip whether they score 90 apiece or 130. Total points is a property of style; margin is a property of the difference in quality plus single-game variance. Those are different axes, and the data treats them as such. This is also why raw scoring volatility is not the same as team quality, the point we made measuring the most and least consistent teams: how much a score swings and how good a team is are separate questions.
Honest limitations
Total points is a blunt instrument. We split games only by combined score. A sharper test would control for pace directly — possessions, not points — because a high total driven by efficiency and a high total driven by tempo are different animals that this analysis lumps together. It is possible a cleaner design surfaces a small effect that the raw total washes out. We doubt it moves much, given how flat the quartiles are, but we would not claim to have ruled out every subtle relationship.
One season, one league-year. This is 2023-24, a specific and fairly high-scoring season. The near-zero correlation is unlikely to be a fluke — it falls straight out of margin being a difference and total being a sum — but the exact blowout and close-game shares are a snapshot, not a constant, and would drift with the scoring environment.
Margin is not drama. A game decided by 12 can be a one-possession game with 90 seconds left that gets salted away at the line, and a game decided by 5 can be a 20-point lead that got cosmetically trimmed in garbage time. Final margin is a crude proxy for how close a game felt, and the "close" and "blowout" buckets inherit that crudeness. Play-by-play win probability would tell a richer story than a final score can.
The takeaway
Sort a whole NBA season from its lowest-scoring games to its highest and the average margin of victory does not budge — 11.9 at the bottom, 11.9 at the top, with a couple of points of wobble in between. The comfortable story that shootouts are tight and grind-it-out games are blowouts is just a story; the final margin is a difference and the total is a sum, and the two live on separate axes. If you want to know whether a game will be close, the amount of scoring in it is one of the least useful things you can know. Ask instead how far apart the two teams are — and then accept that most of the rest is luck.
Sources & Further Reading
- Game-by-game scores: bundled
data_layer/nba_home_results.csv(2023-24, all 1,231 games; Basketball-Reference / public data). Totals, margins, and correlations computed directly from final scores. - Point differential, margins, and single-game variance: Dean Oliver, Basketball on Paper.
- Live scores and box scores: Basketball-Reference and NBA.com/stats.