If you believe the loudest version of the analytics story, the recipe for a good NBA offense is simple: shoot more threes, shoot fewer long twos, and the efficiency will follow. So we tested it. We took every team's shot diet from a sample of 25,000 shots, lined each team's three-point share up against its offensive rating, and measured how tightly they move together. The answer is not the clean line the story promises. The correlation is real, positive, and weak — and the two best offenses in the league sat at opposite ends of the shot-diet spectrum.
The thesis: diet matters, but less than you think
Here is our position up front, before the table. Shot selection is a genuine lever on offensive efficiency — the points-per-shot math we keep hammering in points per shot is not fake. But at the level of a whole team over a whole season, how a team shoots explains far less of its offense than how well it shoots and passes. Diet is a nudge, not a destiny. A modern shot chart is neither necessary nor sufficient for a great offense, and 2023-24 has the receipts.
The exhibit: three-point share versus offensive rating
We computed each team's share of attempts that were three-pointers from the bundled shot sample, then paired it with that team's offensive rating — points scored per 100 possessions — from the season ratings file. Sorted from the most three-happy team to the least.
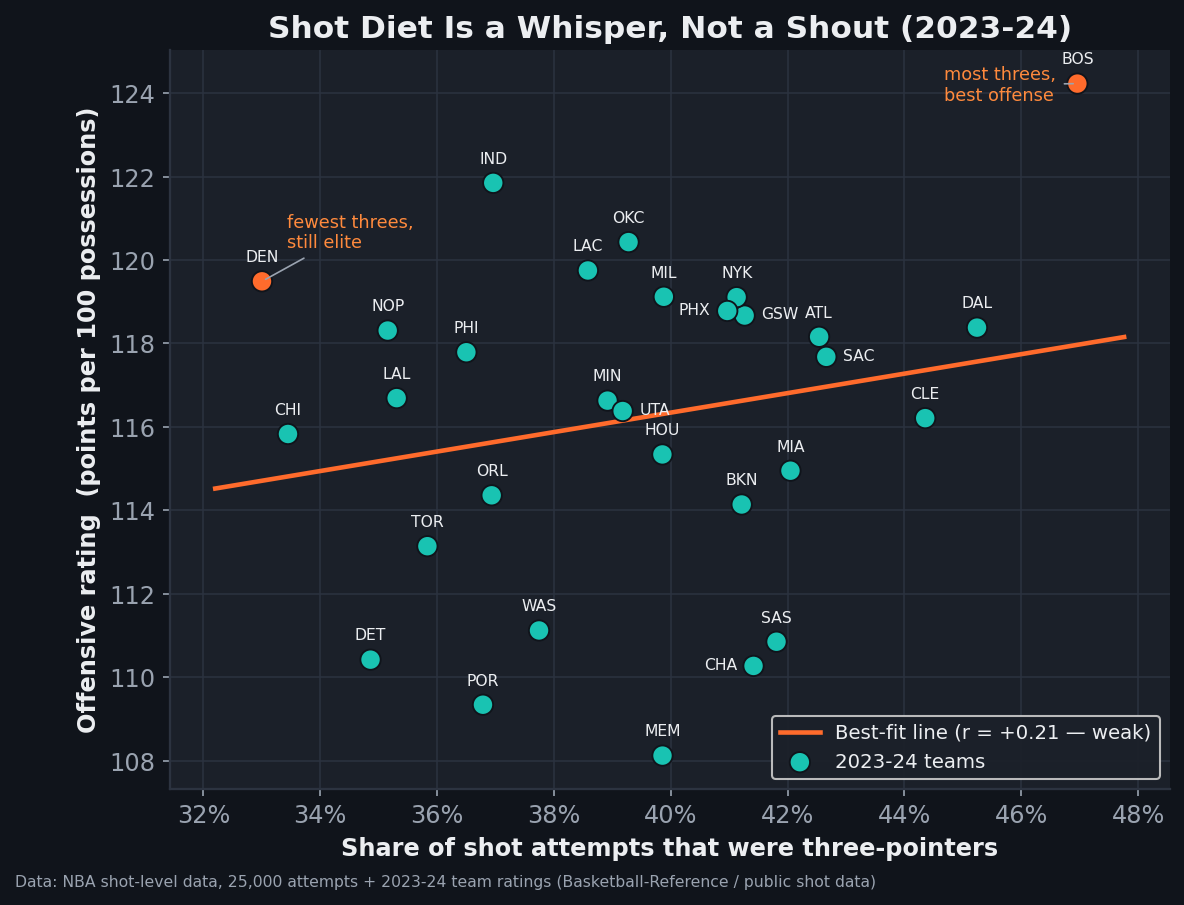
data_layer/nba_league_shots.csv, joined by team name to data_layer/nba_ratings.csv (2023-24; Basketball-Reference / public shot data). Charted by chart_shot_diet_ortg.py with a stamped provenance footer.| Team | 3PA share | Rim share | ORtg | Wins |
|---|---|---|---|---|
| Boston Celtics | 47.0% | 26.8% | 124.2 | 64 |
| Dallas Mavericks | 45.2% | 26.2% | 118.4 | 50 |
| Cleveland Cavaliers | 44.4% | 29.7% | 116.2 | 48 |
| New York Knicks | 41.1% | 30.2% | 119.1 | 50 |
| Milwaukee Bucks | 39.9% | 30.6% | 119.1 | 49 |
| Oklahoma City Thunder | 39.3% | 28.4% | 120.4 | 57 |
| Indiana Pacers | 37.0% | 32.3% | 121.9 | 47 |
| Orlando Magic | 36.9% | 35.4% | 114.4 | 47 |
| Chicago Bulls | 33.4% | 32.4% | 115.8 | 39 |
| Denver Nuggets | 33.0% | 33.0% | 119.5 | 57 |
Source: shot shares from bundled data_layer/nba_league_shots.csv (25,000 attempts; roughly 800 per team), joined to offensive ratings from data_layer/nba_ratings.csv (2023-24). Selected teams shown to span the range; correlations below are computed over all 30. Backcourt heaves excluded.
The correlation between three-point share and offensive rating across all 30 teams is +0.21. Positive — teams that shoot more threes do tend to score a little more efficiently — but 0.21 is a whisper, not a shout. It means three-point share explains under 5% of the variation in offensive rating. The other 95% is everything else: shot-making, spacing, turnovers, passing, offensive rebounding, free throws. If shot diet were the master key, that number would be up near the correlations we found for net rating and wins. It is nowhere close.
The two teams that break the story
The cleanest way to feel how weak 0.21 is: look at the top of the offensive-rating column and find the shot diets there. Boston led the league in offensive rating at 124.2 — and also led in three-point share at 47.0%. Perfect, on-message, the poster child for the analytics recipe. But the fifth-best offense, Denver at 119.5, took the fewest threes in the league, 33.0%, and leaned on the rim and the mid-post as heavily as anyone. Same tier of offensive excellence, opposite shot charts.
Denver is not a fluke; it is Nikola Jokić. An offense organized around an all-time passing big who scores from the post and the elbow does not need to live behind the arc to be devastating — it manufactures great shots through gravity and playmaking rather than through volume threes. Indiana tells a similar story from another direction: the second-best offense in the league at 121.9, at a modest 37.0% three-point share, powered by pace and the best rim-and-kick machine in basketball. The recipe that produced Boston's offense and the recipe that produced Denver's have almost nothing in common, and both worked. That is what a 0.21 correlation looks like in the wild.
The rim-share twist
Here is the finding that most surprised us, and it is a good lesson in not reading a correlation backwards. Rim share — the fraction of a team's shots that came at the basket — correlated negatively with offensive rating, at −0.23. That sounds insane, because the rim is the single most efficient place to shoot, as the distance data in how accuracy falls with distance makes plain. How can shooting more at the best spot on the floor go with a worse offense?
Because rim share is not a choice a good offense makes; it is often a symptom of a bad one. The teams with the highest rim shares in 2023-24 — Orlando at 35.4%, Denver aside — frequently got there because they couldn't space the floor and shoot, so their offense collapsed inward by necessity. A team that can't make threes forces its way to the rim not out of strategic genius but because the jump shot isn't falling. The rim is the best shot; a rim-dependent offense is often a team that has run out of better options. Correlation is not the point value of the shot — it is the type of team that ends up taking it. This is the trap we warned about reading any single number in reading a shot diet: the same shot means different things on different rosters.
Why the recipe still isn't wrong
None of this means the three-point revolution was a mistake — the league-wide shift we traced in how the NBA got more efficient without shooting better was real and rational. The point is subtler. Shot-value math tells you what to do holding shooting ability constant: given two teams that shoot equally well, the one that swaps long twos for threes scores more. But teams are not equal shooters, and at the team-season level the differences in shooting talent and playmaking swamp the differences in diet. The recipe is correct advice for a given team improving its own offense; it is a poor predictor of which team's offense is best. Denver should probably still take a few more threes at the margin — and it would still be an elite offense if it didn't.
Honest limitations
The shot sample is a slice. Each team's diet here is built from roughly 800 sampled shots, not its full ~7,000-attempt season. That introduces real sampling noise into every team's shares, which will attenuate the correlations — the true relationship could be modestly stronger than 0.21, though we would be surprised if it climbed anywhere near the range where diet "explains" offense. Read the shares as good estimates, not exact season totals.
Offensive rating is a team stat with many parents. ORtg folds in turnovers, offensive rebounding, and free-throw generation — three of the four factors that have nothing to do with where a team shoots from. Correlating one slice of shot selection against the whole offense guarantees a low ceiling, because we are comparing one factor to a number built from all of them.
Share is not efficiency within a zone. Two teams can take the same 40% of their shots from three and get wildly different results depending on whether they make them. This analysis is about the mix, deliberately, but a full account of offense has to layer make rates on top of the mix — and make rate, not mix, is where most of the 95% lives.
Causation runs both ways. Good shooting teams take more threes because they can, and we have measured the diet, not the cause. The weak positive correlation is as consistent with "shooting ability drives both" as with "diet drives efficiency," and this data can't separate them.
The takeaway
Line up all 30 teams by how modern their shot chart looks and the best offenses do not sort neatly to the top. Boston shot the most threes and had the best offense; Denver shot the fewest and had the fifth-best; the correlation between the two is a faint +0.21, and rim dependence, counterintuitively, travels with worse offenses because it is so often a symptom of teams that can't shoot. Shot diet is a real lever, worth pulling at the margin, and the points-per-shot arithmetic behind it is sound. But it is a nudge on top of the thing that actually decides offenses, which is whether your players can put the ball in the basket and find each other doing it. You can push the mix around on the Shot-Value Explorer and watch expected points move — just remember the real spread between NBA offenses lives in the make rates you type in, not the shares.
Sources & Further Reading
- Shot-level shares: bundled
data_layer/nba_league_shots.csv(25,000 attempts; Basketball-Reference / public NBA shot data). Team ratings:data_layer/nba_ratings.csv(2023-24 ORtg/DRtg/NRtg). Shares and correlations computed with a pandas groupby onTEAM_NAME. - Points-per-possession and shot-value framing: Dean Oliver, Basketball on Paper.
- The geography of modern shot selection: Kirk Goldsberry, Sprawlball.
- Team offensive ratings and the four factors: Basketball-Reference Glossary; live data at NBA.com/stats.