Luka Dončić scores more efficiently than the average NBA shot — 1.15 points per shot to the league's 1.09 — and he does it while taking a shot diet the analytics crowd is supposed to hate. He lives in the mid-range, fires above-the-break threes off the dribble, and almost never does the two things efficiency models love: finish at the rim or knock down catch-and-shoot corner threes. With 1,652 of his real shots in hand, here's what one superstar's shot selection actually looks like next to everyone else's — and why “inefficient” shots aren't inefficient when you're the one creating them.
The exhibit: where Luka shoots vs. where the league shoots
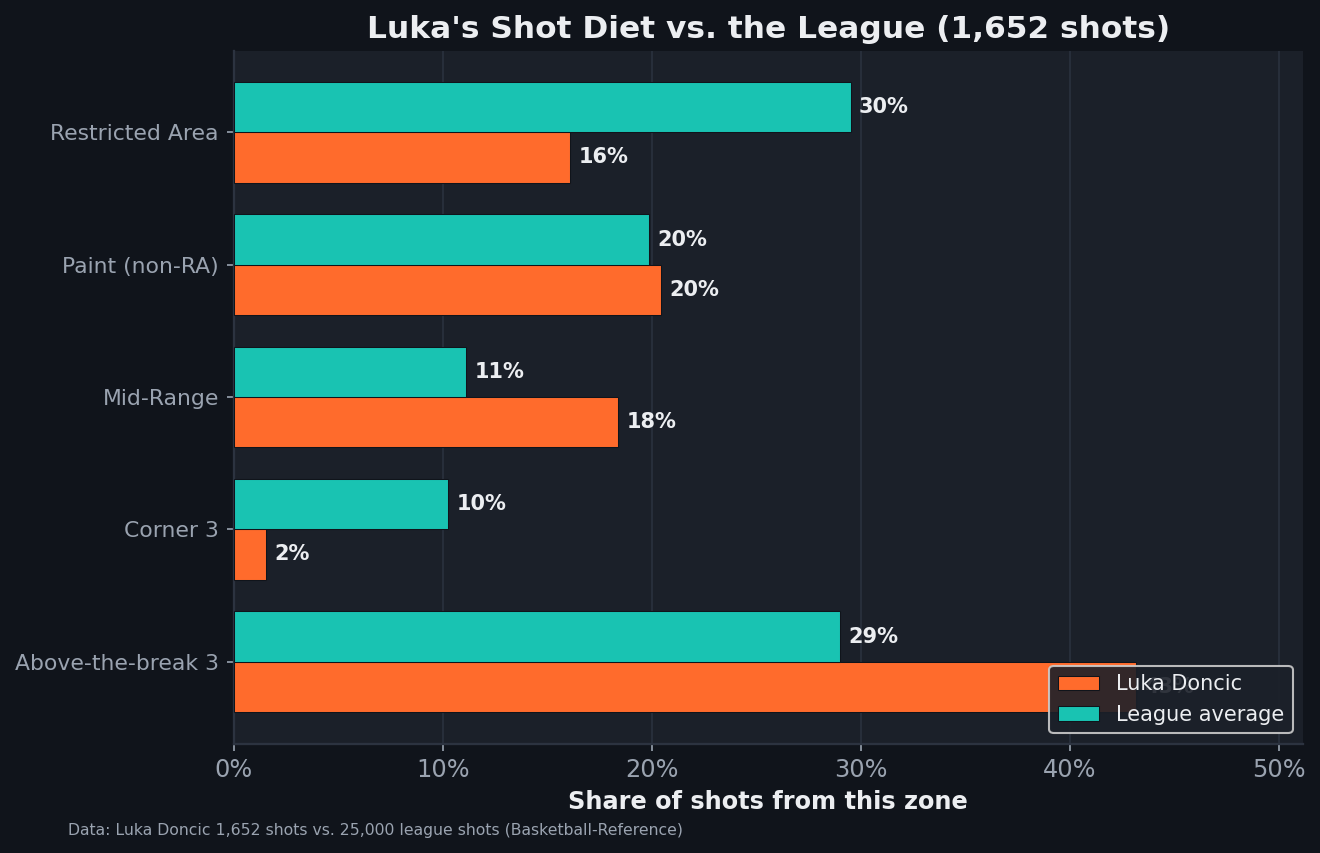
The differences are stark in three places:
- The rim: 16% vs 30%. The average NBA shot is twice as likely to come from the restricted area as Luka's is. He simply doesn't live at the basket the way most high-volume scorers do.
- The corners: 2% vs 10%. The corner three — the most efficient shot in basketball — is almost absent from his diet. Corner threes are spot-up shots created by someone else's drive; Luka is the someone else.
- Above-the-break threes and mid-range: way up. 43% of his shots are above-the-break threes (vs 29%) and 18% are mid-range pull-ups (vs 11%) — the off-the-dribble shots a primary creator generates for himself.
Why the “bad” shot diet still scores
Shot-selection orthodoxy says to maximize rim attempts and corner threes and minimize the mid-range, because those are the highest points-per-shot zones on average. Luka inverts that and still beats the average. Two things explain it.
First, those averages are about shot creation, not shot making. The corner three is efficient largely because it's an open, assisted shot. A rim attempt is efficient because it's usually a layup off a defense already broken down. Those are the easy looks a system manufactures. Luka mostly doesn't get those looks — he manufactures offense for teammates — so his own attempts are, by design, harder. That he converts them at an above-average clip is the skill.
Second, his shots come with gravity attached. An above-the-break three or a mid-range pull-up for Luka is a contested, off-the-dribble shot that bends the defense and creates the very corner threes and rim runs his teammates feast on. The efficiency of those teammate shots doesn't show up in his shot diet, but it's a direct product of it. Judging a creator purely by his own shot chart misses half of what he does.
The lesson: context beats the zone map
This is the trap in reading a shot chart: the league-wide value of a zone assumes an average shot from that zone, taken in average circumstances. A high-usage creator's mid-range pull-up and a role player's mid-range bail-out are the same dot on the map and completely different shots. The right way to grade a shooter isn't “does he take the analytically blessed shots” — it's “does he convert the shots his role actually generates, and does he generate good ones for others.” By the first test Luka clears the bar (1.15 PPS); by the second, his whole diet is the evidence.
Where this read has limits
- One player, one sample. This is 1,652 shots from a single star, not a roster of creators. Luka is one (extreme) example of the creator profile, not proof that every high-mid-range scorer is efficient — most aren't.
- Points-per-shot ignores free throws and turnovers. A creator's value includes drawing fouls and the turnovers that come with high usage; raw points-per-attempt sees neither. True shooting and usage-adjusted metrics complete the picture.
- Zones are coarse. “Above the break” lumps a 24-footer with a 30-foot pull-up; the real difficulty varies enormously within a zone, and a contested-vs-open split would sharpen the story.
- It doesn't measure the gravity directly. The claim that Luka's diet creates teammate efficiency is the standard read of a creator's role, but this shot-chart data can't quantify the assists and defensive distortion — that needs play-by-play and tracking data.
The takeaway
Luka Dončić is a living rebuttal to a too-simple reading of shot charts. He takes the shots the efficiency models warn against — mid-range pull-ups, above-the-break threes, hardly anything at the rim or in the corners — and still beats the league's points per shot, because the zone averages were never about a creator making his own hard looks. The map tells you which shots are easy on average; it doesn't tell you whose job it is to take the hard ones. For a player like Luka, the “inefficient” shot diet is the offense.
Reproduce it
Tag each of Luka's 1,652 shots and the league's 25,000 by zone, compute the share of shots from each, and the points per shot (3 for a made three, 2 for a made two). The chart is regenerated by charts/chart_luka_shot_diet.py against the bundled data_layer/nba_player_shots.csv and nba_league_shots.csv — no network, nothing hand-entered.
Sources & Further Reading
- Free textbook: Chapter 16: Shot Quality Models — the theory behind this, at DataField.dev.
- Shot-level data: bundled
data_layer/nba_player_shots.csv(Luka Dončić, 1,652 shots) anddata_layer/nba_league_shots.csv(25,000 league shots), charted bycharts/chart_luka_shot_diet.py. Underlying data: Basketball-Reference. - Related: Points per shot and shot selection and reading a shot diet — the zone-value framework this piece complicates.
- Related: True shooting percentage — the efficiency stat that folds in free throws and shot value.