Strength of schedule sounds like something that should punish good teams and reward bad ones — the league propping up stragglers with easy slates. The 2023-24 data says the opposite. Compute every team's schedule from the net rating of the opponents it actually played, and the toughest schedules belonged to some of the worst teams in the league, while the best teams cruised through the easiest. The spread from hardest to easiest was about 1.3 net-rating points per game — and the reason it runs backwards from intuition is a quirk of arithmetic nobody can opt out of: you never get to play yourself.
The exhibit: who actually had it hard
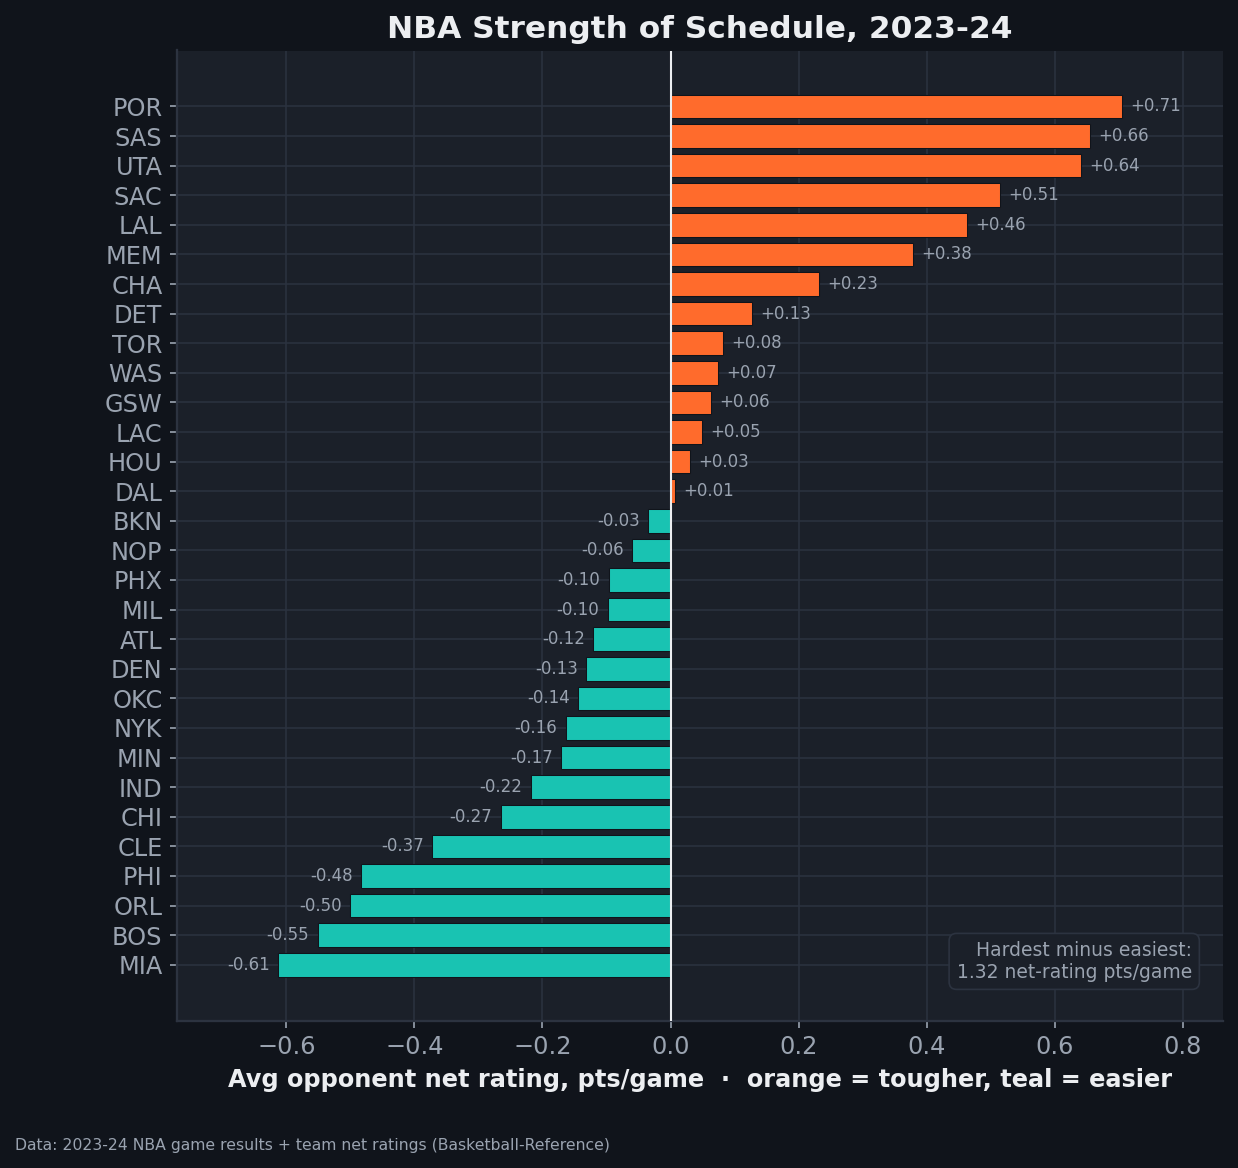
Look at the top of the chart: Portland (+0.71), San Antonio (+0.66), Utah (+0.64) — three of the league's weakest teams, all with the hardest schedules. At the bottom: Miami, Boston, Orlando, Philadelphia — good Eastern teams with the easiest. The Boston Celtics, the best team in the league by net rating (+11.7), faced the second-softest schedule in basketball. That's not a conspiracy; it's structural.
Why it runs backwards
Two forces produce this, and the bigger one is almost a trick of definition:
- You never play yourself. A team's schedule is built from the other 29 teams. If you're the best team in the league, the pool of opponents everyone else faces includes you — but your own pool doesn't. Boston's opponents never had to play Boston, so the average quality of Boston's schedule is dragged down by its own absence. The better you are, the more this flatters your schedule. Symmetrically, a dreadful team like Portland never plays Portland, so its schedule looks tougher.
- Conference imbalance. In 2023-24 the West was the stronger conference, and teams play more games inside their own conference. So Western teams faced a tougher slate on top of the self-exclusion effect — which is why the hardest schedules cluster in the West and the easiest in the East.
Stack those together and the “unfair” schedule story inverts: the teams with the toughest road were mostly bad Western teams carrying both penalties at once, and the teams with the easiest were good Eastern teams getting both discounts.
A worked example
Imagine a league of 30 teams where 29 are exactly average (net rating 0) and one, Boston, is +12. Every other team plays Boston a few times, so every other team's strength of schedule is slightly positive — they all had to face the juggernaut. Boston, meanwhile, only ever plays average teams, so its schedule rates exactly 0 — the easiest in the league. Boston did nothing to earn the soft slate; it got one automatically by being the team that's removed from its own schedule. Real life just adds 29 teams of varying quality and a conference split on top of that same effect.
How much does 1.3 points actually matter?
A 1.3 net-rating-point swing in schedule is real but modest. Spread across 82 games it's the difference between facing roughly average opposition and facing opposition a bit above or below it every night — worth a few wins over a full season, not a playoff seed by itself. It matters most at the margins: a team fighting for the last play-in spot whose record was quietly inflated or deflated by a soft or brutal slate. It's also why analysts prefer net rating and schedule-adjusted ratings to raw record — the standings bake in a schedule the teams didn't choose. For the broader point about how much of any single game is signal versus noise, see how much of an NBA game is luck.
Where this measure falls short
- It's raw opponent quality only. A complete strength-of-schedule model also weighs rest (back-to-backs), travel (road trips, time zones), and home/away balance. Facing a great team at home on three days' rest is easier than a mediocre one on the road in a back-to-back; this number sees only the opponent's rating. See the back-to-back penalty for that side.
- Opponent rating is end-of-season. We rate opponents by their full-season net rating, but teams change over a year (injuries, trades, the All-Star break). A team you played in October may not be the team that rating describes.
- The self-exclusion effect is mechanical. Part of the “easy schedule” for great teams isn't a real break — it's just that they can't pad their own schedule. Adjusted systems handle this; a raw average doesn't.
- One season. 2023-24 had a strong West; the direction of the conference effect flips in years the East is stronger. The self-exclusion effect, though, is permanent.
The takeaway
Strength of schedule in the NBA isn't a handicap system that helps the weak — mechanically, it tends to do the reverse, handing the best teams the softest slates because they're the one opponent missing from their own calendar. The 2023-24 spread of 1.3 net-rating points a game is enough to nudge a few records and a play-in seed, but the real lesson is interpretive: when you see a team's win total, remember it was earned against a schedule the team never picked — and that the schedule quietly favored the teams that needed the help least.
Reproduce it
For each team, gather every opponent it faced in data_layer/nba_home_results.csv, look up each opponent's net rating in nba_ratings.csv, and average them — that's the team's strength of schedule. Sort and chart. The figure is regenerated by charts/chart_nba_sos.py. No network at build time, nothing hand-entered.
Sources & Further Reading
- Free textbook: Chapter 17: Team Offensive Efficiency — the theory behind this, at DataField.dev.
- Game results and team ratings: bundled
data_layer/nba_home_results.csvandnba_ratings.csv(2023-24), charted bycharts/chart_nba_sos.py. Underlying data: Basketball-Reference. - Related: net rating power ranking and how much of an NBA game is luck.
- Related: the back-to-back penalty — the rest-and-travel side of schedule difficulty.