Suppose you knew everything about how good two NBA teams were — their full-season net ratings, who's home, the works. How well could you call the final margin? The surprising, slightly humbling answer from the 2023-24 season: not very. Knowing exactly how good both teams are explains only about 26% of the variation in final margins. The other ~74% is single-game noise — shooting variance, foul trouble, a hot role player, a bad whistle. An NBA game is roughly a quarter signal and three-quarters luck.
How to split talent from luck
The method is a clean decomposition. For every game I built a predicted margin from things known in advance: the gap in the two teams' season net ratings, plus home court (fit from the data at about +2.1 points). That prediction is the “talent” signal — the best guess you could make from team quality alone. Then I compared it to the actual margin. The leftover — actual minus predicted — is the part no amount of team-quality knowledge can explain. Its size is the luck.
The exhibit: a very fat cloud
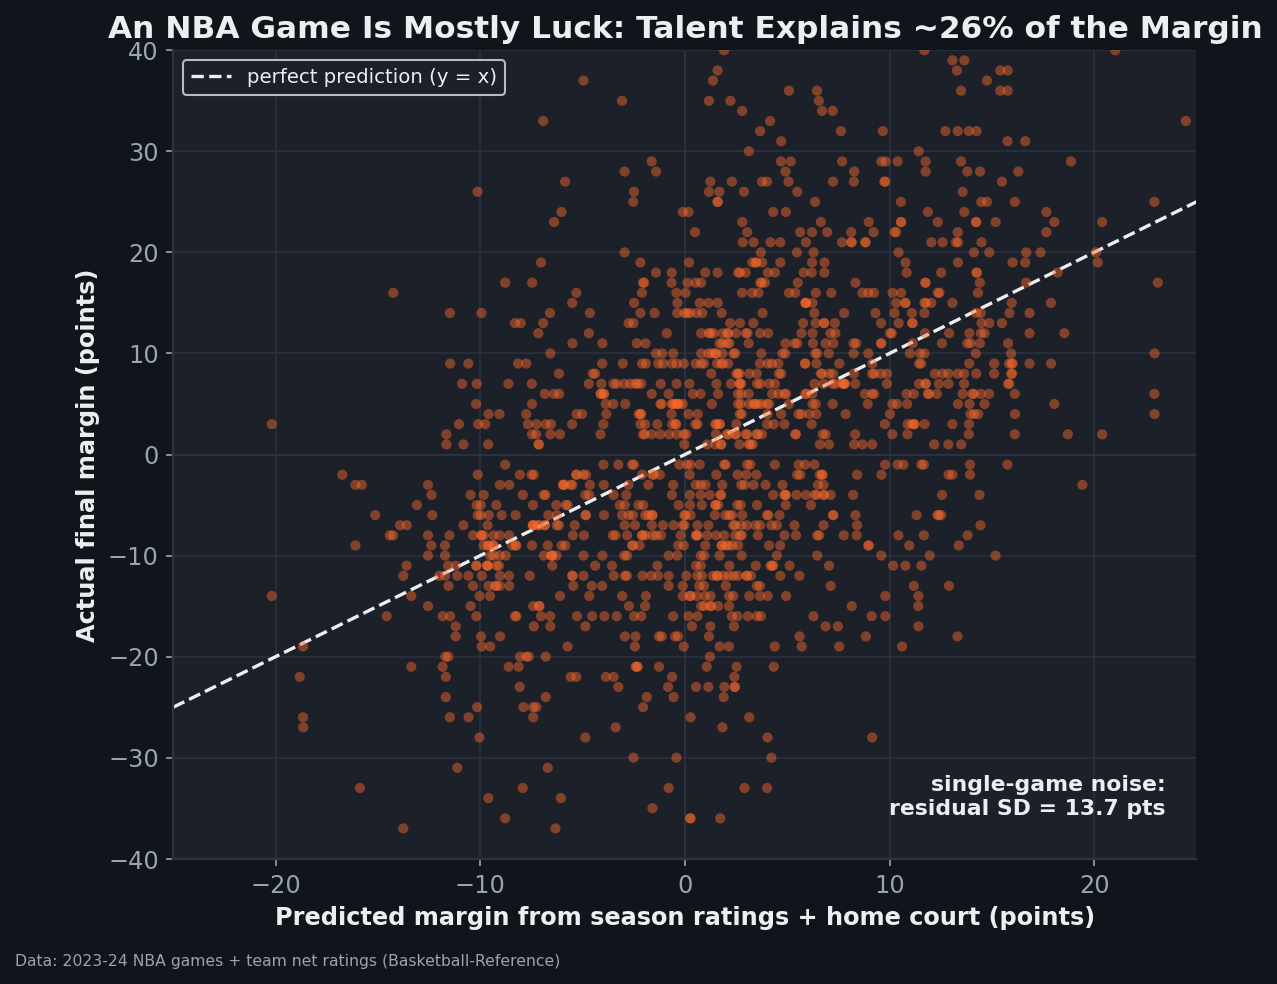
The picture is the argument. If games were decided by talent, the dots would cling to the dashed y = x line. Instead they form a vast vertical smear around it. The actual margin swings with a standard deviation of 15.6 points; the predicted margin only varies by 8.0; and the leftover noise has a standard deviation of 13.7 points. That 13.7 is the headline: even when you know precisely how good both teams are, the typical game still lands about a touchdown-and-a-half — in basketball terms, two possessions and change — away from what you'd predict, in either direction.
Why this isn't a paradox
“The better team usually wins” and “a single game is mostly luck” sound contradictory, but both are true, and the reconciliation is the whole point. A small, consistent edge wins most of the time without controlling any one result. A +6 favorite is genuinely likely to win — but the ±13-point noise means plenty of those games still tip the other way. It's exactly why the better team wins about 68% of games, not 95%, and why an 82-game season — not a single night — is what separates the contenders from the pretenders. Talent is a thumb on the scale, not a hand around the throat.
What's in the 74%
The “luck” bucket isn't literally all random — it's everything the season-rating prediction can't see for one specific night:
- Shooting variance. Three-point makes are famously streaky; a team that hits 18 threes one night and 7 the next swings the margin 30+ points with the same shot quality. This is the biggest single ingredient.
- Availability and matchup. A star resting, foul trouble, or a specific stylistic mismatch can move a single game without changing either team's season rating.
- Rest and schedule. A back-to-back is worth a few points the season average doesn't capture for that game.
- Genuine randomness. A buzzer-beater in or out, a whistle that goes one way — the irreducible coin-flip residue.
A smarter pregame model (using injuries, rest, and recent form) would claw back some of the 74% — but not most of it. A large chunk of an NBA game is, and always will be, noise.
Honest limitations
- Net rating is an imperfect, partly in-sample proxy. Season net ratings are themselves estimated with error and were computed from these same games, so the “talent” signal is fuzzy at the edges. A cleaner out-of-sample prediction would explain a bit less, if anything — so 26% is roughly an upper bound on what season quality alone buys you.
- “Luck” is a residual, not a measurement. The 74% lumps true randomness together with knowable-but-unmodeled factors (injuries, rest, matchups). It's the ceiling on how much a better single-game model could improve, not a claim that three-quarters of basketball is literally chance.
- One season. The exact split will move year to year, but the shape — talent a minority, noise the majority of single-game margin variance — is a stable feature of a high-variance sport.
- Margin, not winning. This decomposes the point margin; win probability is a related but separate question (a tiny edge can win often while explaining little margin variance).
The takeaway
The next time a good team loses a game it “should” have won, resist the narrative. The data says a single NBA game is about three-quarters noise around a one-quarter talent signal — so even perfect knowledge of both teams leaves the typical result ±13 points uncertain. That's not a flaw in the sport; it's why we play the games, why the season is long, and why one night tells you so much less than it feels like it should.
Reproduce it
Predict each game's margin as (home NRtg − away NRtg) + HCA (HCA fit as the mean leftover home margin), subtract from the actual margin, and compare variances: the talent share is var(predicted) / var(actual) and the luck is the residual standard deviation. The scatter is regenerated by charts/chart_margin_luck.py against the bundled data_layer/nba_home_results.csv and nba_ratings.csv — no network, nothing hand-entered.
Sources & Further Reading
- Free textbook: Chapter 25: Game Outcome Prediction — the theory behind this, at DataField.dev.
- Game results and team net ratings: bundled
data_layer/nba_home_results.csvanddata_layer/nba_ratings.csv(2023-24), analyzed bycharts/chart_margin_luck.py. Underlying data: Basketball-Reference. - Related: How often does the better team win? — the same talent-vs-luck split, framed as win probability.
- Related: Are NBA win streaks real or random? and how often is a game actually close? — more of the noise story.