"They're on the second night of a back-to-back" is the most common excuse in basketball, and for once the excuse checks out. Reconstruct every team's 2023-24 schedule from the dates and the cost of a back-to-back is clean and symmetric: a team playing its second game in two nights, against a rested opponent, won just 41.9% of the time and lost by an average of 2.8 points — while the rested team on the other side won 58.1%. Fatigue is worth about eight points of win probability and a field goal of margin. And the part that proves it's real: when both teams are tired, it's back to a perfect coin flip.
How I measured it
The game log doesn't label back-to-backs, but it doesn't need to — the dates do. A team is on the second night of a back-to-back if it played the day before. I tagged every team in every game that way, then split the season by the rest matchup: both teams rested, one team on a back-to-back against a rested opponent, the reverse, or both on a back-to-back. Then I just counted wins and margins in each bucket. No model, no assumptions — only the schedule and the scoreboard.
The exhibit: rest is a differential, not a state
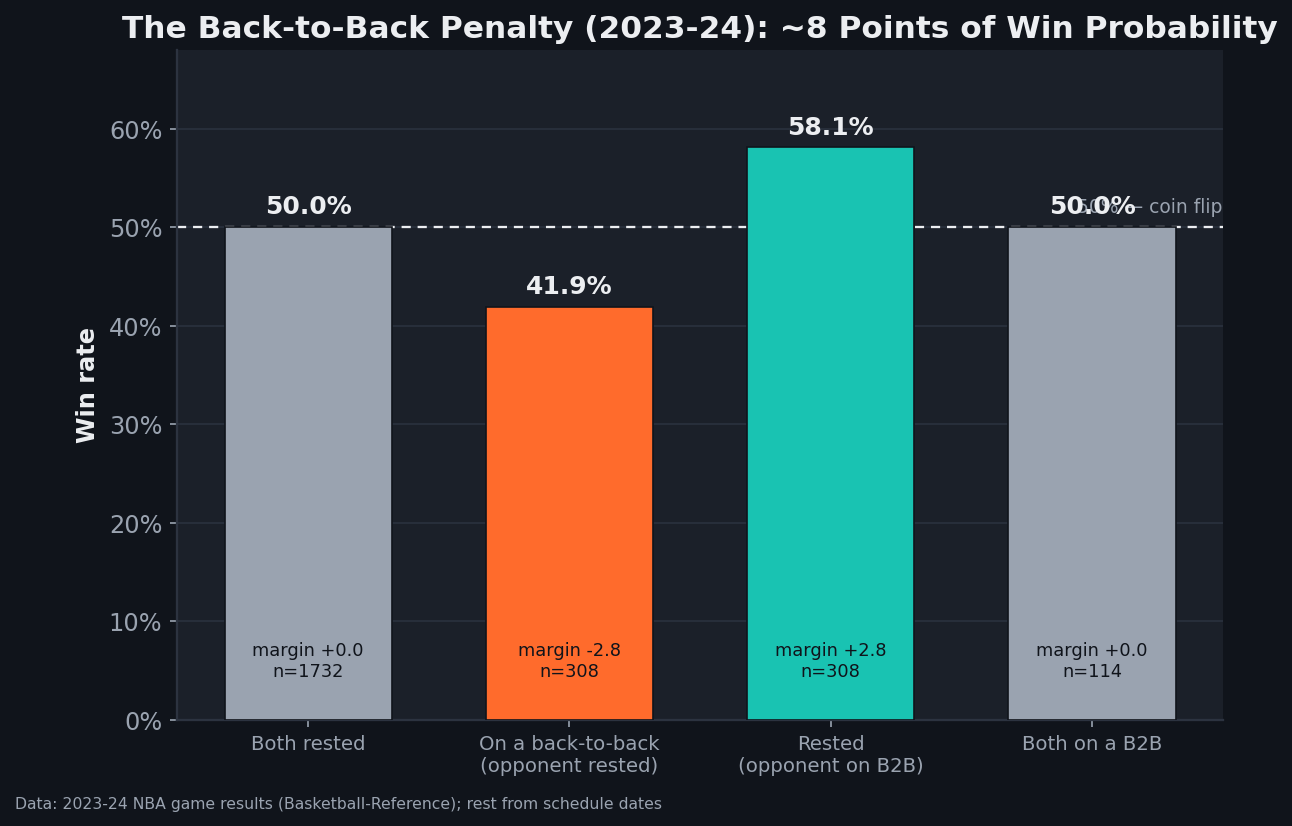
The symmetry is the tell. Both rested: 50.0%. Both on a back-to-back: 50.0%. The absolute fatigue level doesn't matter — what matters is the gap between the two teams. A tired team playing a tired team is even; a tired team playing a fresh one is in trouble. And the effect is perfectly conserved: the rested team's +2.8 margin is exactly the tired team's −2.8. Rest doesn't create or destroy points; it transfers them from the fatigued side to the fresh one.
Why ~3 points is a big deal
A 2.8-point swing sounds small until you place it next to the league's other famous edge: home-court advantage is worth only a couple of points itself. A one-sided back-to-back is, in effect, large enough to cancel home court — a tired home team and a rested visitor are roughly even. It's also right in the range that flips close games: the NBA is decided by single digits often enough that three points of expected margin moves a meaningful number of outcomes from the win column to the loss column.
What's behind the number — and what isn't
The mechanism is exactly what you'd guess: legs. Tired teams shoot worse, especially from three and late in games, defend with less close-out energy, and lean on shorter rotations. That's why load management exists — teams are trading a few regular-season back-to-back games to keep stars fresh for the games that matter. But two honest caveats keep the number in proportion:
- It's the rest differential, not a curse. The data says a back-to-back only hurts when the opponent is fresher. Schedules are roughly balanced over a season, so every team both suffers and benefits; the penalty mostly washes out in the standings and shows up game-to-game.
- Schedule-makers aren't random. The league tries to avoid the harshest spots, and a team's back-to-backs aren't evenly distributed against strong and weak opponents. Some of the bucket differences carry a sliver of matchup-quality noise, not pure fatigue.
Limits of this read
- Sample sizes shrink at the edges. The one-sided buckets are a few hundred games each — enough to be confident in an ~8-point effect, not enough to trust the exact decimal. The "both on a B2B" bucket (114 games) is smallest.
- It ignores travel and distance. A back-to-back with a cross-country flight is surely worse than two home games on consecutive nights; "played yesterday" is a blunt proxy for true fatigue.
- It doesn't separate stars resting out. Some second-night games feature a star sitting for load management, which is itself part of the back-to-back effect but muddies "fatigue" versus "missing players."
- One season. The pattern is stable and intuitive, but the exact magnitude will wobble year to year with scheduling and rule changes.
The takeaway
The back-to-back excuse is legitimate, with a precise price tag: about eight points of win probability and a field goal of margin — but only against a fresher opponent. Equal rest, equal odds. It's a reminder that a lot of what looks like a team being "flat" is just the schedule, and a reminder to read a box score with one eye on the calendar. When a good team drops a game it "should" have won, check whether it was the second night of a back-to-back against a team that slept in its own bed. Often, that's the whole story.
Reproduce it
Rebuild each team's schedule from the game dates, flag any game played one day after the team's previous game as a back-to-back, split every team-game by the rest matchup, and average wins and margin in each bucket. The chart is regenerated by charts/chart_back_to_back.py against the bundled data_layer/nba_home_results.csv — no network, nothing hand-entered.
Sources & Further Reading
- Free textbook: Chapter 24: Injury Risk and Load Management — the theory behind this, at DataField.dev.
- Game-by-game results: bundled
data_layer/nba_home_results.csv(1,231 real 2023-24 games), rest derived from the dates bycharts/chart_back_to_back.py. Underlying data: Basketball-Reference. - Related: Rest, back-to-backs, and load management — why teams trade these games for playoff freshness.
- Related: Home-court advantage — the comparably-sized edge a back-to-back can cancel.
- Related: How often is an NBA game actually close? — why a 3-point swing flips real outcomes.