Here is the finding, and it surprised me even after I'd run the numbers twice: in 2023-24, the single most common kind of NBA game was not a tight one. It was a blowout. Across all 1,231 regular-season games in the bundled log, more games ended with a margin of 20 or more points (19.1%) than ended within a single possession of three or fewer (13.9%). The league we narrate as a nightly parade of buzzer-beaters is, in the aggregate, a league of double-digit decisions. The median game finished 10 points apart.
What the distribution actually looks like
Every game has one number that survives the highlights: the final margin. Bin all of last season's margins by size and the shape of the sport falls out. I split every game into seven absolute-margin bands and counted how many landed in each.
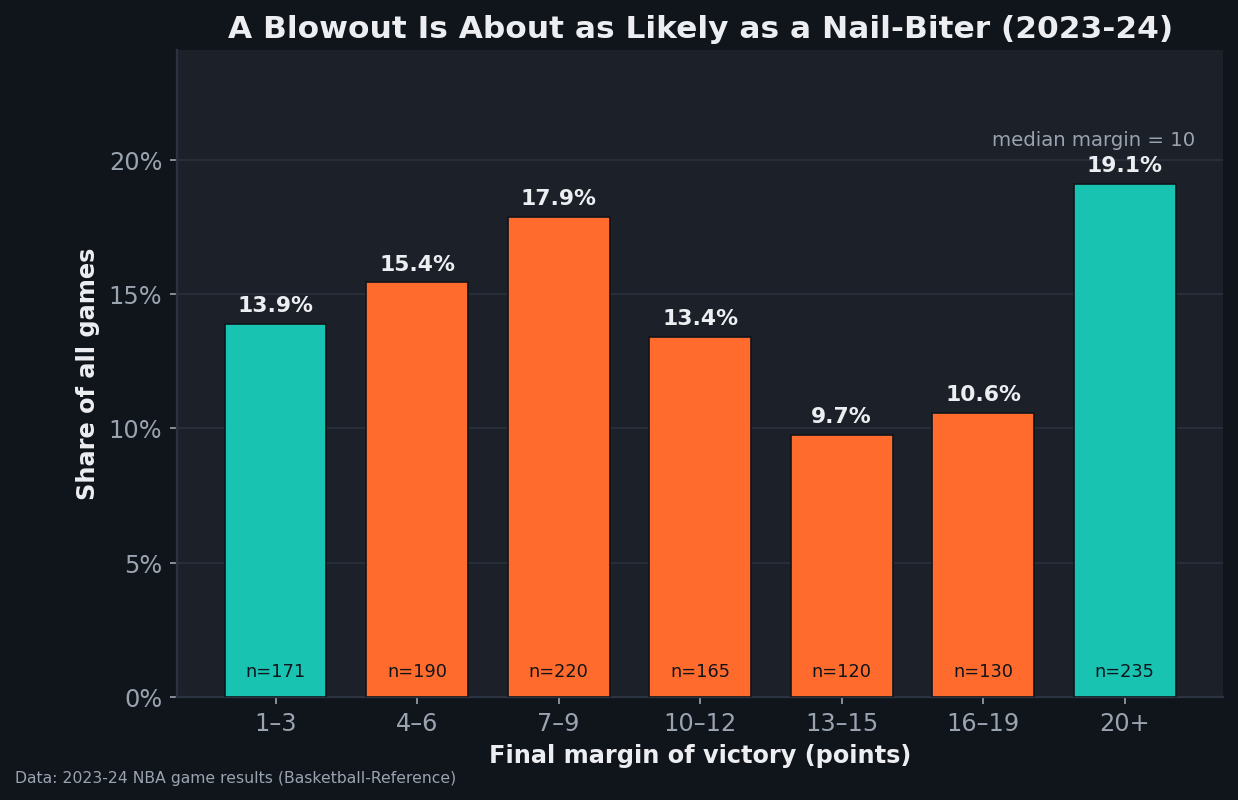
Read it tail to tail. One-possession games (1–3 points) made up 13.9% of the season. Games decided by 20 or more made up 19.1% — the tallest bar on the chart. In between, the most populated "normal" band was 7–9 points at 17.9%. Add it up and only about 29% of games finished within six points, while nearly 40% were decided by 13 or more. The basketball night you actually got, most of the time, was a game that was effectively over before the fourth quarter.
Why this clashes so hard with the vibe
If blowouts are that common, why does it feel like every game is close? Three reasons, and they're worth separating because they're about perception, not the data.
First, survivorship in the highlights. The clips that travel are clutch shots, comebacks, and overtimes — the 13.9% gets 90% of the airtime. Nobody cuts a 30-second package of a team leading wire-to-wire by 18. The close games are overrepresented in memory because they're overrepresented on your phone.
Second, garbage time disguises blowouts as competitive games. A team can lead by 22 with five minutes left, empty the bench, and lose the last stretch 14–6, trimming the final margin to 14. The game was never in doubt, but the box score reads "14-point game," not "blowout that closed politely." That bench-mob run also quietly distorts player stats, which is its own problem — I dug into how much in garbage-time distortion. The point here is that the margin distribution, if anything, undercounts true blowouts.
Third, the close games are where attention concentrates. We don't watch the whole 1–3 band; we watch the ends of them, at maximum intensity, and that intensity stamps the memory harder than three quarters of a 19-point laugher ever could.
So is the NBA less competitive than we think?
Not necessarily — and this is where I have to be careful, because "19% blowouts" is the kind of stat that gets weaponized into a "the product is broken" take it doesn't support. A wide margin distribution is exactly what you expect from a league of unequal teams playing 82 games. When a 60-win team hosts a tanking 20-win team, the expected margin is large; the blowout isn't a competitive failure, it's the correct result. The spread of final margins is mostly a readout of the spread in team quality, not evidence that close games are dying.
You can see the same logic from the other direction. A game's margin is roughly the gap in team strength plus a big dose of single-night noise — shooting variance, foul trouble, rest. That noise is why even mismatches occasionally finish within three, and why two evenly matched teams sometimes produce a 25-point night that means nothing. The margin distribution is the convolution of real talent gaps with that randomness, which is the same machinery that makes clutch performance so hard to pin on skill: by the time a game is "clutch," most of the signal has already been spent.
A quick worked check: where do the close games hide?
If you want to feel why the "wire-to-wire" intuition misfires, condition on the matchup instead of the league. Take the games and you'll find the one-possession finishes cluster between teams of similar quality, while the cross-tier matchups supply most of the 20+ band. The league-wide histogram blends both, so the average fan — who watches a mix — experiences the blend and remembers the close ones. There's no contradiction between "most individual games aren't close" and "the games I remember were close." Both are true; the second is a sampling artifact of the first.
It also explains a related quirk I found when I split games by margin in the home-court advantage piece: the home edge barely exists in coin-flip games and shows up mostly in the blowouts. Home court doesn't help you steal a nail-biter so much as it helps you turn a comfortable win into a rout — which, given how common routs are, is a bigger share of the standings than the clutch narrative would have you believe.
How to reproduce it
This is one CSV and a histogram. Each row is a real 2023-24 game with both teams' points; the absolute margin is abs(home_pts − away_pts), and the chart bins those margins into the seven bands and counts the share in each. It's regenerated by charts/chart_margin_distribution.py against the bundled data_layer/nba_home_results.csv — no model, no formula, just frequencies. Swap in another season's game log and you'll get that year's shape; my bet is it looks a lot like this one, because the spread of team quality doesn't change much from year to year.
Sources & Further Reading
- For the fundamentals, see Chapter 25: Game Outcome Prediction in DataField.dev’s free textbook library.
- Game-by-game results: bundled
data_layer/nba_home_results.csv(1,231 real 2023-24 regular-season games), binned bycharts/chart_margin_distribution.py. Underlying data: Basketball-Reference. - Related: Garbage-time distortion — why true blowouts are undercounted by the final margin.
- Related: Clutch, quantified — what's left to decide once a game is actually close.
- Related: Home-court advantage in the 2023-24 games — where the home edge actually lives on the scoreboard.