"Defense wins championships" is the oldest cliché in basketball, and in 2023-24 the data politely disagreed. Line up all 30 teams' offensive and defensive ratings against their records and the offense is the tighter fit: a team's offensive rating correlated with winning at r = +0.87, its defensive rating at r = −0.75. Squared into share of variance explained, that's 76% for offense against 56% for defense. In this season, knowing how well a team scored told you more about its record than knowing how well it stopped anyone.
It's a real edge and, like most single-season edges, a modest one. So before "offense wins championships" gets carved into a new stone tablet, the sturdier finding is the one underneath: the thing that actually predicted 2023-24 wins wasn't offense or defense. It was the gap between them — net rating — which correlated with winning at r = +0.98 and made the whole offense-versus-defense debate mostly beside the point.
What these ratings measure
Everything here runs on three numbers, all per 100 possessions so that fast and slow teams are compared fairly. Offensive rating (ORtg) is points scored per 100 possessions; defensive rating (DRtg) is points allowed per 100; net rating (NRtg) is simply ORtg minus DRtg. Per-possession is the key: a run-and-gun team and a walk-it-up team can score the same total points per game while being wildly different offenses, and only the per-100 view sees that. (If these are new, start with offensive and defensive rating explained and the possession that anchors them.)
The exhibit: two sides of the ball, side by side
Here's the question drawn out — each team as one dot, win percentage on the vertical, with each panel carrying its fitted line and its real r and R². The defense panel is flipped so that better defense (fewer points allowed) reads left-to-right, like the offense panel, so the eye can compare the two clouds directly.
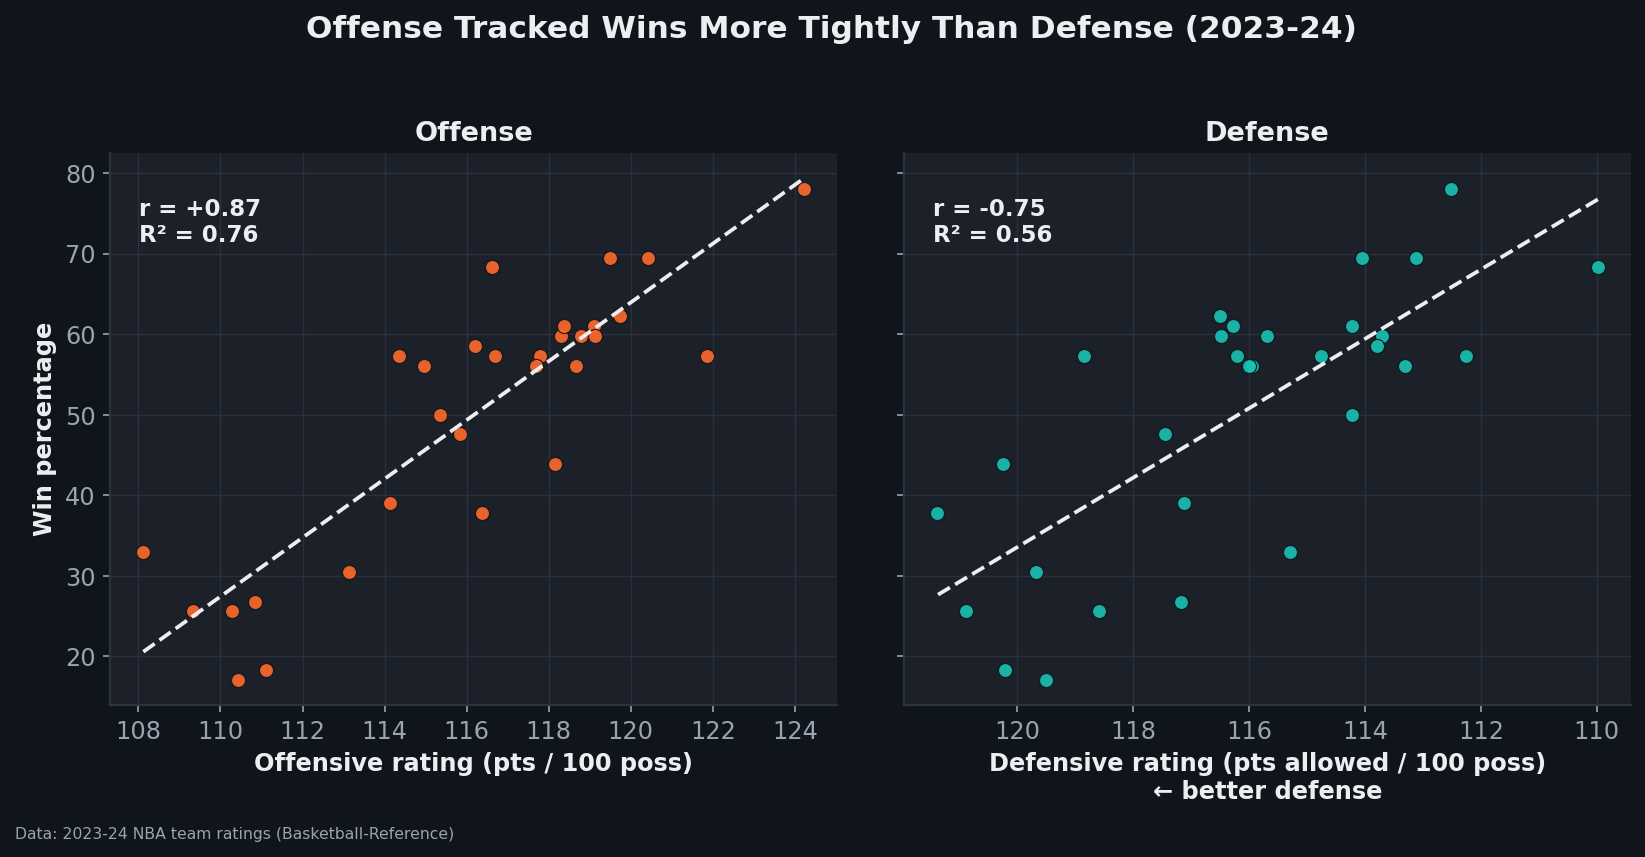
Look at the two clouds before the numbers. Both slope the right way — more efficient offense and more efficient defense both go with winning — but the left-hand (offense) cloud clings to its line more closely. The Celtics anchor the top of both panels (a league-best 124.2 offensive rating and a 64-win season), proof that the cliché's exceptions are usually just great teams that are good at everything.
Why net rating ties it together
The offense-versus-defense framing hides a flaw worth naming: a point scored and a point prevented are the same thing in the standings. Both move your net rating by one. That's why neither side alone cracks an R² of 0.80, but their difference — net rating — jumps to r = +0.98 (R² = 0.96). Net rating explains 96% of the variation in records because it stops treating scoring and stopping as rivals and just measures the margin. A team that adds three points of offense and one that saves three points of defense have done identical work toward winning.
So the reason offense "won" 2023-24 by a few hundredths of a correlation point isn't some deep truth that buckets matter more than stops. It's mostly that this season's spread in team offense happened to be a little wider and cleaner than the spread in defense — the best offenses separated from the pack a touch more than the best defenses did. A point is a point. Net rating is the honest scoreboard.
A worked example: pricing rating points into wins
Turn the abstract correlation into something concrete by fitting win total to each rating across all 30 teams. The offense line says each extra point of offensive rating was worth about +3.0 wins over the season; the defense line says each point shaved off defensive rating was worth about 3.5 wins. Wait — doesn't a bigger slope mean defense matters more? No, and this is the subtle part: the slopes differ because offensive and defensive ratings had slightly different spreads across the league this year. A steeper slope on a narrower spread can still explain less of the standings than a gentler slope on a wider one. That's exactly why correlation (which is scale-free) is the right tool for "which predicts better," and slope is the right tool for "what's one point worth." They answer different questions, and conflating them is how the cliché survives.
Where this breaks — and it breaks in familiar places
I have to be blunt about the limits, because a few-hundredths gap invites overclaiming.
- One season, thirty teams. Thirty points is a small sample, and the 0.87-vs-0.75 gap sits well within the wobble you'd expect year to year. Run 2022-23 or pool a decade and defense often pulls even or ahead — in the long run a point saved and a point scored are worth the same. Anyone claiming a single season settles the debate is selling noise as signal.
- Correlation isn't causation. Good teams win and post strong ratings because they're good; talent is a common cause sitting behind both. Net rating's 0.98 is high precisely because it captures total quality, not because margin mechanically produces wins.
- Ratings carry context these totals ignore. Pace, strength of schedule, injuries, and garbage-time minutes all sit unadjusted inside raw ORtg and DRtg. Adjusted, opponent-aware versions exist for exactly this reason, and they can shift the margins.
- "Championships" ≠ regular-season wins. This measures the regular season. The playoffs are a different, smaller, higher-variance sample where defense and shot-making under pressure may carry weight the 82-game correlation can't see. The cliché is really a claim about June, and June is the hardest month to measure.
So what actually won in 2023-24?
The defensible reading is narrow and more useful than a slogan: in 2023-24, offensive efficiency correlated with winning a little more tightly than defensive efficiency did — 0.87 to 0.75, 76% of the variance to 56%. That's a real measurement, not a fluke of one team, but a thin edge I wouldn't extrapolate past this season. The bigger, sturdier finding is that the question is slightly wrong: offense and defense aren't rivals, they're two inputs to one quantity, and that quantity — net rating, at r = 0.98 — is what predicted the standings. Whichever side of the ball got a team further ahead on the margin is the side that "won."
Reproduce it
Every number here comes from one CSV of 2023-24 team ratings and a few lines of arithmetic. The two correlations are corr(W/L%, ORtg) and corr(W/L%, DRtg); the net-rating figure is corr(W/L%, NRtg); the worked slopes fit wins ~ rating by least squares. The two-panel exhibit, both fit lines, and the printed r / R² are regenerated by charts/chart_offense_vs_defense_nba.py against the bundled data_layer/nba_ratings.csv — no network, nothing hand-entered. Swap in another season's ratings and the same script will tell you whether that year rewarded offense or defense.
Sources & Further Reading
- For the fundamentals, see Chapter 17: Team Offensive Efficiency in DataField.dev’s free textbook library.
- Team ratings (ORtg, DRtg, NRtg) and records: bundled
data_layer/nba_ratings.csv(2023-24, 30 teams), charted bycharts/chart_offense_vs_defense_nba.py. Underlying data: Basketball-Reference. - Per-possession ratings originate with Dean Oliver, Basketball on Paper; definitions via the Basketball-Reference glossary.
- Related: Offensive and defensive rating explained and the value of a possession — the metrics underneath this.
- Related: The four factors — what actually drives a team's offensive and defensive ratings.