Load management is the most argued-about acronym-adjacent idea in modern basketball, and almost nobody arguing about it has looked at the actual gap. So I did: I split a full season of team games by how many days of rest each side had, then put the second night of a back-to-back — zero days off — next to everything else. The result is the most annoying kind of finding, because it lets nobody win the argument. Rest matters. It just matters less than the people resting their stars would like you to believe.
How I sliced it
The setup is deliberately boring, which is the point. I took every team-game from the 2025-26 regular season and derived rest from the calendar: for each team I looked at the date of its previous game and counted the days off in between. Zero days off — a game the night after the team already played — is the second leg of a back-to-back. Everything with at least one day of rest goes in the "rested" bucket. No travel adjustments, no opponent-quality controls, no cherry-picking marquee names; just a clean split of the whole league so the sample can't be accused of having an agenda.
That gives 441 back-to-back second nights against 1,989 rested games. Big enough that the differences aren't noise, plain enough that you can check the arithmetic yourself.
The needle does move
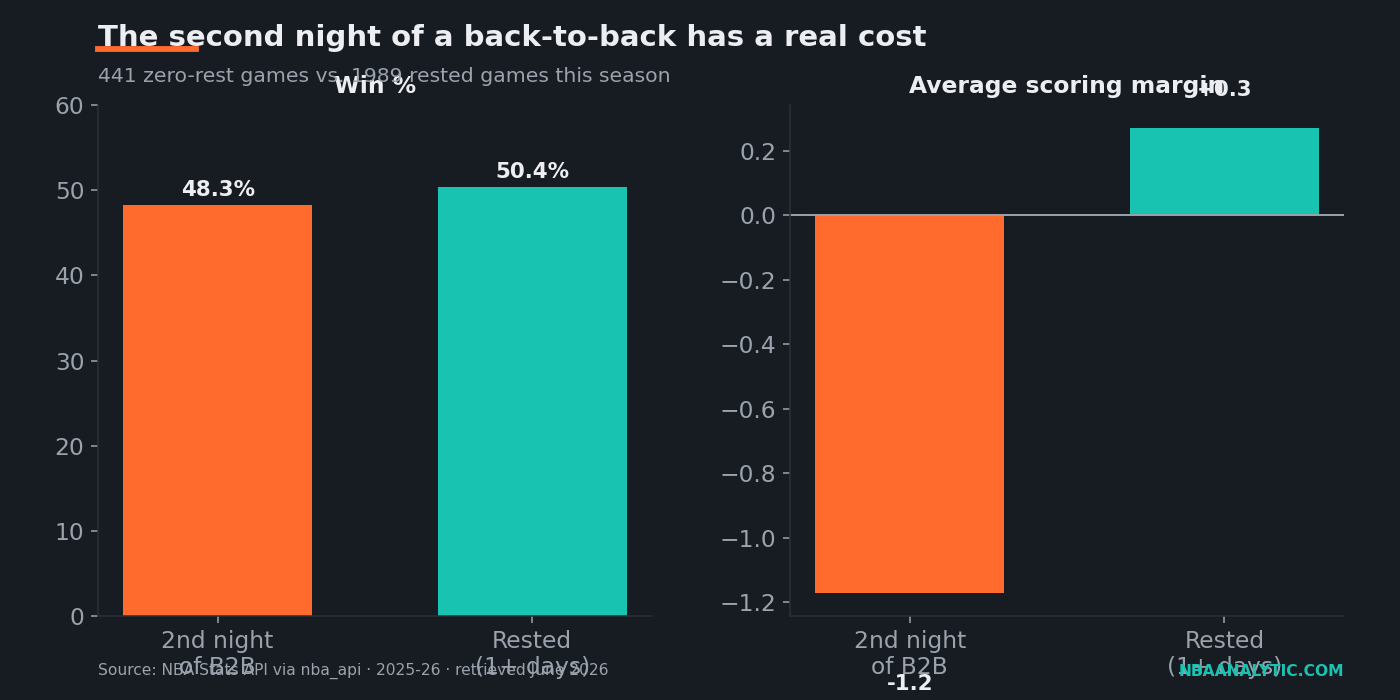
On the second night of a back-to-back, teams won 48.3% of the time. Rested, they won 50.4% — which, since every game has a winner, is roughly the coin flip you'd expect a league-wide pool to land on. The dead-legs penalty is that 2.1-percentage-point gap. It shows up everywhere else too, in exactly the direction fatigue predicts: scoring drops from 115.7 points to 114.8, field goal percentage slips from 47.2% to 47.0%, and average scoring margin falls from a faintly positive +0.27 all the way to -1.17.
That margin swing — a 1.44-point drop — is the cleanest single number here. A team that is, on average, a hair better than its opponent on normal rest becomes a team that loses by more than a point per game the night after playing. Tired legs don't just cost you the close ones; they shave a point and a half off the whole distribution.
But the needle is not a cliff
Here is the half of the sentence the load-management evangelists skip. A 48.3% win rate is not a death sentence. Teams on the second leg of a back-to-back still won nearly half their games. The drop from a 50.4% baseline to 48.3% is real, but it is the difference between a coin flip and a slightly weighted coin flip — not the difference between contender and tomato can. If fatigue were the cliff casual fans imagine, you'd see B2B win rates in the 30s. You don't. You see something a couple of points below even.
The points and field-goal numbers tell the same modest story. Losing 0.9 points of scoring and 0.2 percentage points of field goal accuracy is the statistical equivalent of a slightly off shooting night, not a different team. Players are tired; they are not incapacitated. The professionals, it turns out, remain professionals on no rest.
| Split | Games | Win% | PTS | FG% | Avg Margin |
|---|---|---|---|---|---|
| 2nd night of back-to-back | 441 | 48.3 | 114.8 | 47.0 | -1.17 |
| Rested (1+ days off) | 1,989 | 50.4 | 115.7 | 47.2 | +0.27 |
Why "real but modest" is the whole point
Both halves of that verdict carry weight, and which one you emphasize depends entirely on your time horizon. For a single game, a 2.1-point win edge is almost invisible — you'd never spot it from the couch, and any one back-to-back can go either way without telling you anything. But basketball is not played one game at a time. Stretch that edge across an 82-game season and it compounds: over the dozen-plus back-to-backs a team plays, a couple of points of win probability per night turns into real games in the standings, and games in the standings turn into playoff seeds. The same small, reliable edge is exactly what makes rest a genuine input for anyone pricing games — it's a known, quantifiable nudge to fold into a win-probability model rather than a hunch.
So when a front office sits a star on the back end of a back-to-back, the honest defense isn't "he'd be useless out there" — the numbers say he'd be roughly 96% of himself. The honest defense is that a healthy star in April is worth more than a 2.1-point bump in a January road game, and the team is trading a small, certain edge tonight for a larger, uncertain one in May. That's a defensible bet. It is also a very different argument from "back-to-backs ruin players," which the data simply does not support. The needle moves. Anyone who tells you it doesn't move at all, or that it swings the whole game, is selling you the same overconfidence from opposite ends.
Sources & Further Reading
- For the fundamentals, see Chapter 24: Injury Risk and Load Management in DataField.dev’s free textbook library.
- Game-level results and box-score data: NBA.com/stats, pulled via the nba_api Python package (2025-26, retrieved June 2026). Rest splits and the back-to-back logic live in
scripts/back_to_backs.py. - Stat definitions and historical context: Basketball-Reference Glossary.