You've seen it on the broadcast: a little bar that says the home team has a 78% chance to win, ticking up and down with every possession. It feels like a fact, reported to you the way the score is reported to you. It is not a fact. It's the output of a model — a fitted function that someone trained on a pile of old games — and like every model, it's an opinion with a confidence interval. Once you know how that number is built, you stop trusting it blindly and start reading it for what it actually is.
What a win-probability model actually does
Strip away the graphics and a win-probability model is doing something narrow and specific. At any frozen moment of a game, it takes a handful of inputs that describe the game state — the score margin, the time remaining, who has the ball, sometimes a measure of the two teams' underlying strength and pace — and it returns a single number between zero and one: the probability that a given team wins from here. That's the whole job. It does not know about momentum, the crowd, or what the coach said in the huddle. It knows the state, and it knows what usually happened next.
The "what usually happened next" part is where the training comes in. You take thousands of historical games, and for every single game state that ever occurred — down four with six minutes left and the ball, up eleven entering the fourth, tied with thirty seconds and possession — you look at how often the team in that spot went on to win. A team trailing by two with a minute left isn't a coin flip; over a large enough sample it might win 38% of the time. The model's entire purpose is to learn that mapping from "situation" to "eventual win rate" and reproduce it on demand for situations it has never seen exactly.
It's just a fitted function
The simplest honest version of this is a logistic regression — the same workhorse used everywhere from credit scoring to medical risk. You assume win probability is a smooth S-shaped function of your inputs and you let the historical data pick the coefficients:
A win-probability model, conceptuallyP(win) = 1 / (1 + e−(β0 + β1·margin + β2·time + …))
Each β is a weight the fitting process tunes so the model's predictions line up with what really happened. A bigger lead pushes the exponent up and the probability toward one; less time remaining sharpens the curve, because a four-point lead with eight minutes left is worth far less than the same four points with forty seconds left. Real production models are fancier than this — they use gradient-boosted trees or splines to bend the curve in ways a straight logistic can't — but the spirit is identical. There is no oracle inside. It's arithmetic fit to history, and history is exactly where the disagreements start.
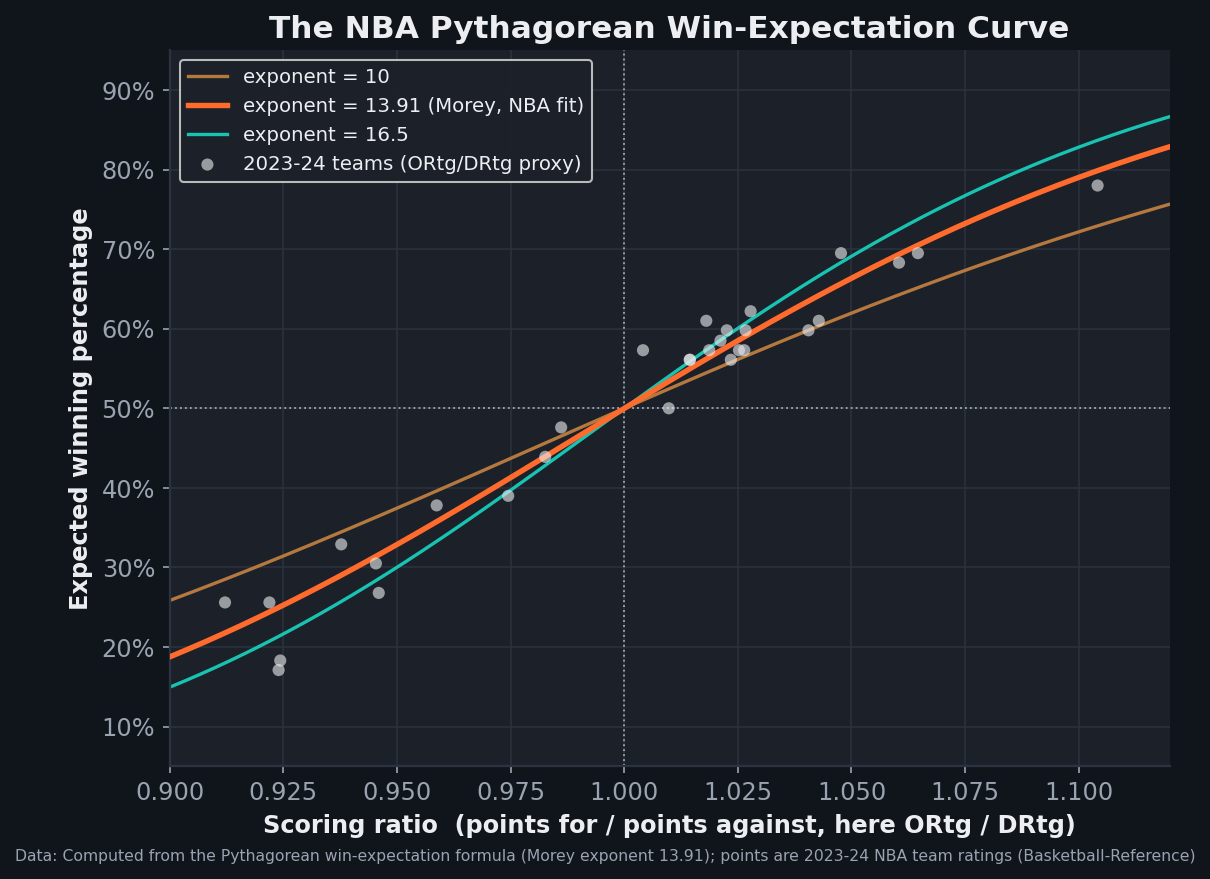
The same S-shaped idea has a season-long cousin that's worth seeing, because it's the cleanest example of "a smooth curve maps a strength signal onto a win probability." The Pythagorean win expectation — Win% = Rx / (Rx + 1), where R is a team's points-for over points-against and x is an exponent fit to the league — predicts a full season's winning percentage from nothing but scoring ratio. For the NBA the best-fit exponent is about 13.91 (Daryl Morey's figure; basketball's high-scoring environment needs a far larger exponent than baseball's ~1.83). Plot the curve and drop the real teams onto it and they hug the line:
Why two good models disagree
If win probability were a fact, every competent model would print the same number. They don't, and the reasons are instructive. Different training data: a model fit on the last three seasons of a high-scoring, three-happy league will price a 12-point lead differently than one trained on a decade that includes slower, grind-it-out basketball, because leads are easier to erase when everyone's launching threes. Different priors on team strength: some models treat both teams as anonymous and judge only the score and clock; others fold in a rating for each team, so an eight-point deficit looks more survivable when the trailing team is genuinely better than its opponent. Those two philosophies will flatly contradict each other in the same moment, and neither is wrong — they're answering slightly different questions.
Garbage time is its own quiet battleground. When a game is decided, the losing team's bench is chucking up shots against the winner's bench, and the margin can swing in ways that have nothing to do with "win probability," which is already pinned at 99%. A model that naively learns from those minutes can get its late-game curve subtly wrong; one that downweights or trims them behaves differently in exactly the situations casual viewers stare at hardest. This is the same family of modeling judgment calls that makes full-season forecasters diverge — I wrote about that in why projection systems disagree, and the live in-game version is just a faster-moving cousin.
The variance the model has to price in
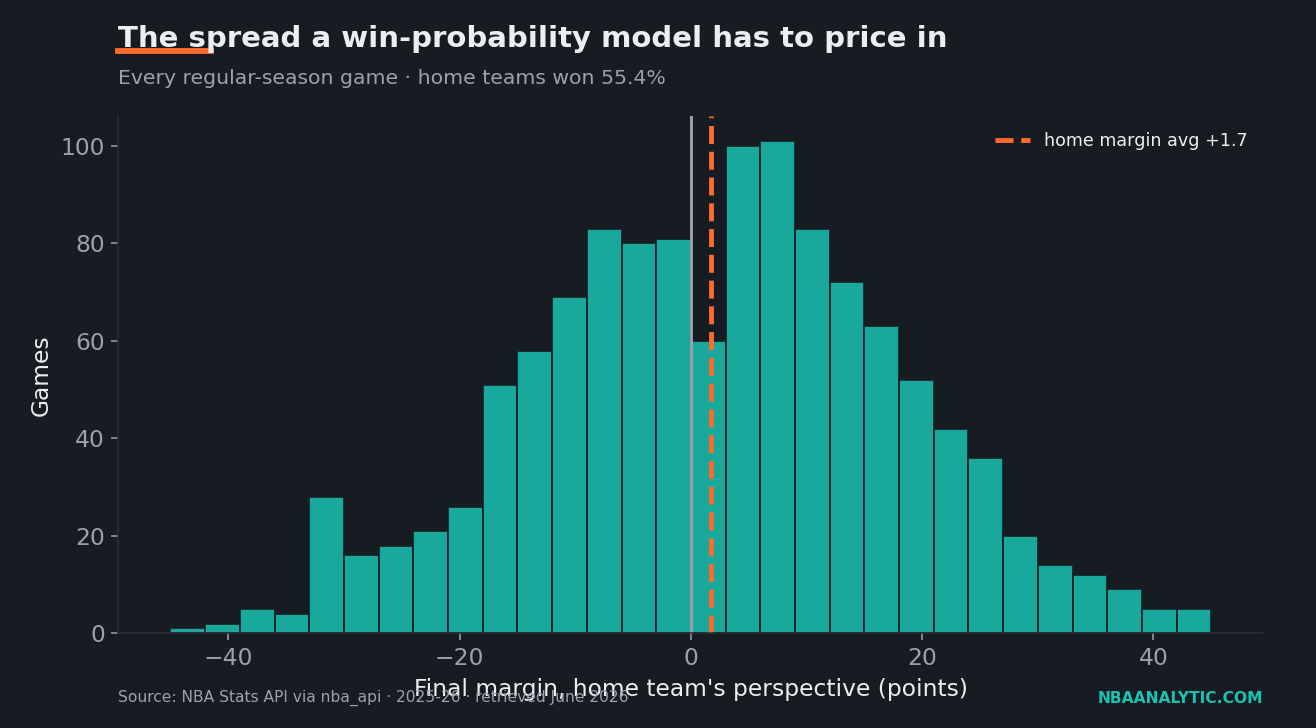
Here's the part the tidy probability bar hides: basketball is loud. Whatever a model believes about a given state, a big chunk of what happens next is simply irreducible variance, and the season's results make that concrete. Across 1,225 games this year, home teams won 55.4% of the time — a real edge, but nowhere near a lock. The average final margin from the home team's perspective was a slim 1.73 points, which sounds like every game is a nailbiter until you see the spread sitting next to it: a standard deviation of 16.4 points. That number is the whole story. The typical game lands a full two-plus possessions away from that average in either direction, which is why a model can never collapse to a confident answer too early.
And the distribution has fat tails on both ends. Only 24.5% of games this season were decided by five points or fewer — the genuine coin-flip finishes — while a nearly identical 22.9% were blowouts decided by twenty or more. A good model has to fit both shapes at once: it can't be so cautious that it refuses to call a 19-point fourth-quarter lead, because almost a quarter of games really do turn into routs, yet it can't be so confident that it writes off a five-point deficit, because a quarter of games are still alive in the final possessions. Calibrating against that two-humped reality is most of the difficulty.
| Metric | Value |
|---|---|
| Games in sample | 1,225 |
| Home win % | 55.4% |
| Average home margin | +1.73 |
| Std. deviation of margin | 16.4 |
| Decided by ≤5 points | 24.5% |
| Decided by ≥20 points | 22.9% |
How to read the number, then
None of this means win-probability models are junk. A well-calibrated one is genuinely useful: when it says 70%, teams in that spot really should win about seven times in ten, and that's more than you could eyeball. The mistake is treating the figure as a measurement rather than a forecast. When the broadcast bar and your gut disagree, the honest questions are the ones we just walked through — what was this thing trained on, does it know these two teams are mismatched, and how does it handle the blowout it might be staring at? The same humility applies before tip-off, where the uncertainty is even larger; I get into that in the preseason prediction piece. A win-probability number is a model telling you its best guess about a famously noisy game. Read it as a guess, and it becomes one of the better ones you have. Read it as a fact, and basketball will spend all season reminding you that it isn't.
Sources & Further Reading
- For the fundamentals, see Chapter 21: In-Game Win Probability in DataField.dev’s free textbook library.
- Game-outcome data: NBA.com/stats, pulled via the nba_api Python package (2025-26, retrieved June 2026). The script that computes these season totals is in
scripts/win_probability_models.py. - The logistic form and the general approach of fitting win probability to historical game states are standard sports-analytics practice; see Basketball-Reference's glossary for related win-based metrics.