Feed two projection systems the same player and they will hand you back two different futures. Not slightly different — sometimes one sees a borderline All-Star and the other sees a rotation piece. The instinct is to assume one of them is broken. It isn't. The disagreement is structural, baked into the choices each system made before it ever saw a single box score, and once you understand where it comes from you stop asking which model is right and start asking which question each one is answering.
Why two systems can't agree on the same player
A projection is just a measurement of the present, pushed forward through assumptions about the future. So the disagreements start at the very first step — the measurement — and compound from there. Two systems can watch the identical season and grade it differently, and they almost always do, because they were built on different foundations.
There are roughly five places where they fork. They start from different base metrics — some are built on the box score, others on plus-minus and what happens to the scoreboard while a player is on the floor. They apply different aging curves, so a 27-year-old is "about to decline" to one model and "in his prime" to another. They weight minutes and role changes differently, so a player moving from sixth man to starter gets a bump in one and a shrug in the other. They regress small samples toward different means at different speeds. And — the big one — they value defense in ways that range from "carefully modeled" to "barely visible." Any one of these is enough to split two forecasts. All five at once is why two reasonable systems can look at the same man and see two careers.
A present-day proxy: when backward-looking metrics already fight
You don't need a forecasting engine to watch this happen. You can see the disagreement in metrics that only describe the past, with no aging curve or projection involved at all — and if the rearview mirrors can't agree, the windshields have no hope.
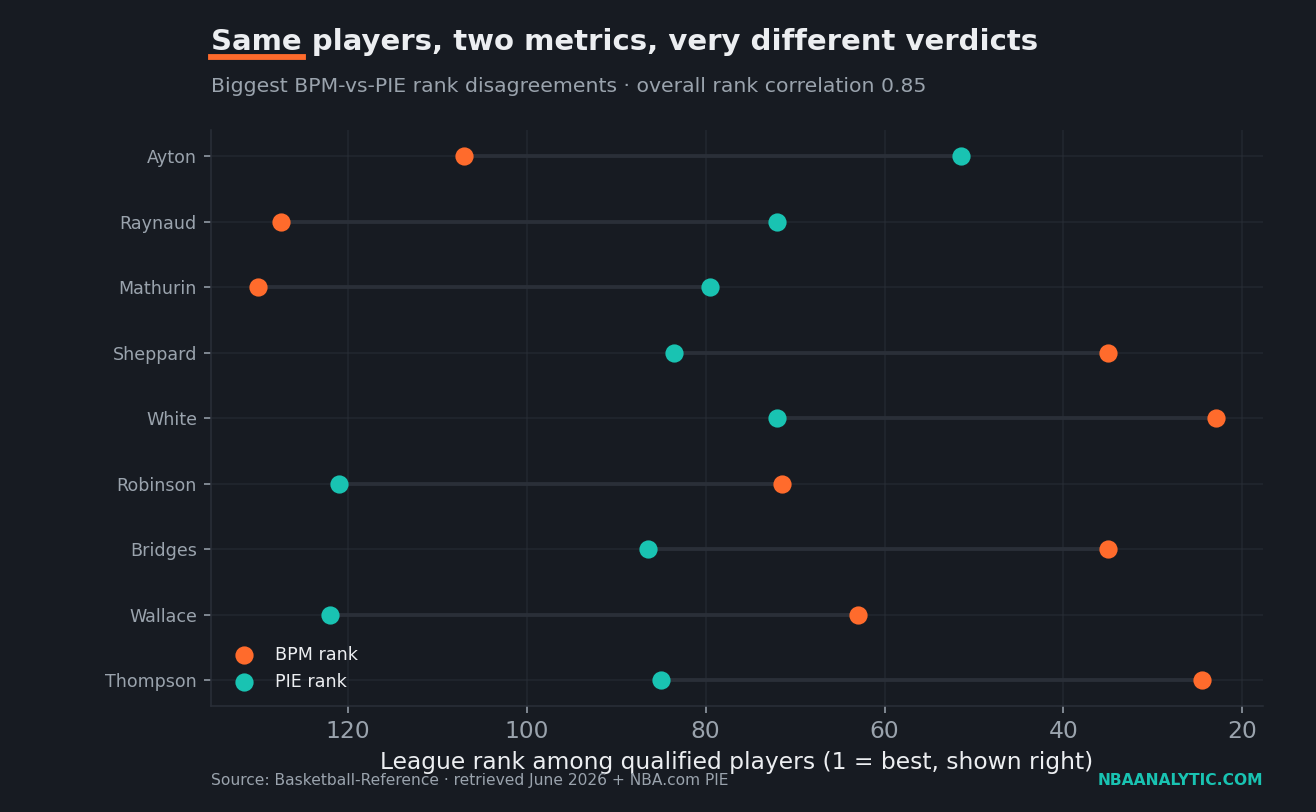
Take two respected all-in-one metrics. Basketball-Reference's Box Plus/Minus (BPM) is built almost entirely from the box score — points, rebounds, assists, steals, blocks, turnovers, position, team context. NBA.com's Player Impact Estimate (PIE) is a different recipe: it's a player's share of the total statistical events generated in their games, a "what percentage of everything that happened was you" number. Both are trying to answer the same question — how good was this player this season — and broadly, they agree. Across the 141 rotation players I matched, the Spearman rank correlation between BPM and PIE is 0.846. That's a strong relationship. The stars cluster at the top of both lists, the end-of-bench guys cluster at the bottom of both, and most players land in roughly the same neighborhood on each.
"Broadly agree," though, is doing a lot of hiding. A rank correlation of 0.846 leaves enormous room for individual players to be ranked wildly differently — and the ones who are tell you exactly what each metric can and can't see.
The players who break the agreement
Here are the matched players where BPM and PIE diverge the hardest. Read each row as two opinions of the same season:
| Player | BPM | BPM rank | PIE | PIE rank |
|---|---|---|---|---|
| Ausar Thompson | 3.1 | 24 | .101 | 85 |
| Cason Wallace | 1.2 | 63 | .076 | 122 |
| Mikal Bridges | 2.7 | 35 | .099 | 86 |
| Duncan Robinson | 0.8 | 71 | .078 | 121 |
| Derrick White | 3.2 | 23 | .109 | 72 |
| Reed Sheppard | 2.7 | 35 | .102 | 83 |
| Bennedict Mathurin | -2.5 | 130 | .105 | 79 |
| Maxime Raynaud | -2.4 | 127 | .109 | 72 |
| Deandre Ayton | -0.9 | 107 | .117 | 51 |
The disagreements aren't random — they're defense and role
Look at the direction of the splits and a pattern jumps out. The players BPM likes far more than PIE — Ausar Thompson (24th in BPM, 85th in PIE), Derrick White (23rd vs 72nd), Cason Wallace (63rd vs 122nd) — are defenders and connective guards. They rack up the steals, blocks, and low-mistake minutes that BPM's box-score formula rewards, while PIE, which is fundamentally a share-of-events stat, undercounts a great defensive possession that ends in a contested miss rather than a stat in their column. Duncan Robinson and Mikal Bridges fall in the same bucket for a related reason: low-usage, high-efficiency role players whose value doesn't show up as a big slice of their team's raw statistical pie.
Now flip it. The players PIE rates far higher than BPM — Deandre Ayton (51st in PIE, 107th in BPM), Bennedict Mathurin (79th vs 130th), Maxime Raynaud (72nd vs 127th) — are high-volume scorers and rebounders. They touch the ball and the glass constantly, generating a large share of countable events, which PIE rewards directly. BPM, which is built to estimate impact on point differential and is harsher on inefficient volume and weak defense, isn't nearly as impressed. Neither metric is hallucinating. One is counting how much of the action ran through you; the other is estimating how much you moved the scoreboard. Those are different jobs, and the players where they part ways are, almost to a man, the players whose value is defensive or role-based rather than raw-production-based.
This is the same fault line that runs through every all-in-one metric, which I get into in more detail in the all-in-one metrics breakdown: box-score systems and plus-minus systems will always disagree most about defenders and low-usage glue guys, because that's exactly the value box scores struggle to record.
Why projections diverge even more
Here's the uncomfortable part. BPM and PIE are backward-looking. They both have the full season in hand. There's no guessing about minutes, no aging assumption, no regression of a 200-minute sample — and they still rank Ausar Thompson 61 spots apart. Now hand that same disagreement to systems whose entire job is the unknowable future.
A projection has to take a metric that already disputes a player's present value and then layer on every fork from earlier: how it ages him, how it handles his new role, how aggressively it regresses a small sample toward league average, how it credits defense it can barely see. Each assumption multiplies the gap. This is why publicly available systems built on different bases — box-score projections, plus-minus engines like the old FiveThirtyEight RAPTOR, impact metrics such as EPM and LEBRON, the play-by-play-driven DARKO — can hand you meaningfully different forecasts for the same role player while broadly agreeing on the superstars. The stars are easy; everyone's metrics see Nikola Jokić. It's the defenders, the small-sample sophomores, and the role-changers where the systems were always going to split, because they split on those players even when they already know how the season ended.
The takeaway
When two projections disagree about a player, that disagreement is information, not noise. The shape of the gap tells you something: a player both systems love is a safe bet, and a player they split on is usually one whose value lives where measurement is hardest — on defense, or in a role that doesn't generate a big slice of the box score. So don't pick the system that flatters your favorite player and call it a day. Read the disagreement itself. It's pointing directly at the parts of basketball we still can't measure cleanly — the same uncertainty that makes win probability models hedge late in close games. The honest version of a projection isn't a single number. It's a number with an argument attached, and the argument is the interesting part.
Sources & Further Reading
- Theory: Chapter 25: Game Outcome Prediction — a free chapter at DataField.dev.
- Box Plus/Minus (BPM) and stat definitions: Basketball-Reference (2025-26, retrieved June 2026).
- Player Impact Estimate (PIE): NBA.com/stats (2025-26, retrieved June 2026).
- Matching, rank correlation, and the disagreement table were computed in
scripts/projection_systems_disagree.py.