Tell us only how many points a team scored and how many it allowed across a full season, and we will guess its record to within about two wins — without knowing a single thing about who it beat, when, or in what order. That is the strange, almost unfair power of Pythagorean expectation. We ran it on all 30 teams from 2023-24, and the model landed within four wins of reality for 27 of them. The three it missed tell you exactly what Pythagorean can't see: the last five minutes of a close game.
The idea, borrowed from baseball
Bill James invented Pythagorean expectation for baseball. The insight is that a team's win percentage tracks its runs scored and runs allowed far more tightly than it tracks the noise of who happened to win the one-run games. Basketball inherited the same logic, with points swapped in for runs. Daryl Morey fit the NBA version and found the exponent that made it work: about 13.91. The formula is one line.
Expected win% = PF13.91 / (PF13.91 + PA13.91), where PF is total points scored across the season and PA is total points allowed. Multiply that by games played and you get expected wins. The high exponent is what makes basketball basketball: a small edge in points-per-game compounds into a large edge in win probability, because NBA games are long and scores are high, so the better team wins far more reliably than a baseball team does over nine innings. This is the same terrain we walked in how many wins a net-rating point is worth — point differential basically is the standings — but Pythagorean gets there through raw points instead of per-100 ratings, and it hands you a win total directly.
The finding: it nails the standings, then leaves a residue
We rebuilt each team's season totals from the game-by-game scores in the bundled 2023-24 file, computed expected wins with Morey's exponent, and subtracted from actual wins. The correlation between expected and actual wins across all 30 teams is 0.981. The mean absolute miss is just 2.1 wins. Nineteen of 30 teams land within two wins of their Pythagorean projection; 27 of 30 within four. For a model whose only two inputs are points for and points against, that is almost embarrassing.
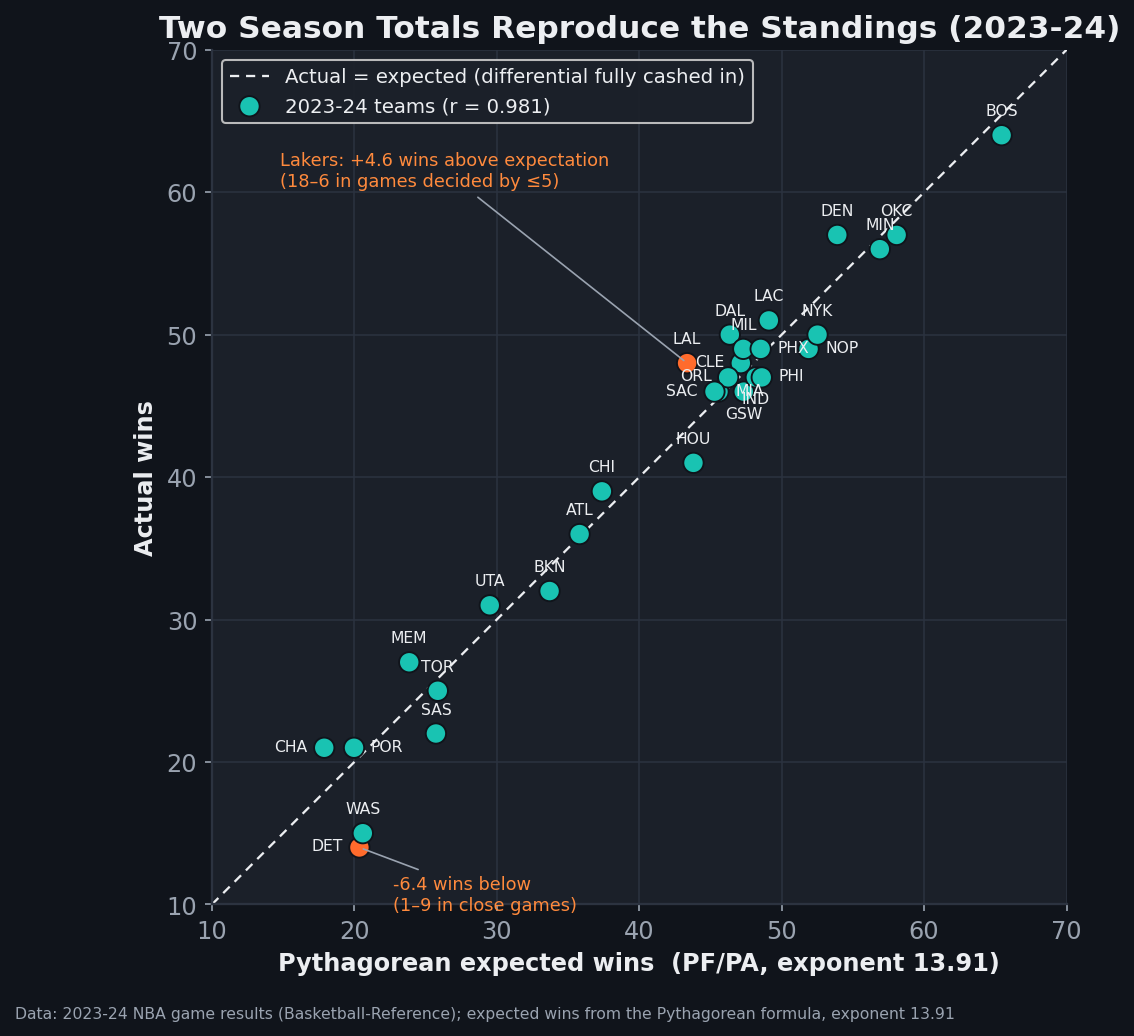
data_layer/nba_home_results.csv (2023-24, 1,231 games; Basketball-Reference), expected wins computed from final scores. Charted by chart_pythag_expected_actual.py with a stamped provenance footer.But the residue — the gap between what a team's point differential earned and what it actually banked — is where the story lives. Here are the teams the model missed by the most, in both directions.
| Team | PF−PA | Expected W | Actual W | Luck (W − exp) |
|---|---|---|---|---|
| Los Angeles Lakers | +63 | 43.4 | 48 | +4.6 |
| Dallas Mavericks | +181 | 46.4 | 50 | +3.6 |
| Memphis Grizzlies | −574 | 23.9 | 27 | +3.1 |
| Denver Nuggets | +431 | 53.9 | 57 | +3.1 |
| … (22 teams within ±3) … | ||||
| New Orleans Pelicans | +362 | 51.9 | 49 | −2.9 |
| San Antonio Spurs | −532 | 25.7 | 22 | −3.7 |
| Washington Wizards | −762 | 20.6 | 15 | −5.6 |
| Detroit Pistons | −747 | 20.4 | 14 | −6.4 |
Source: bundled data_layer/nba_home_results.csv, all 1,231 games of 2023-24. Season PF/PA summed per team from final scores; expected wins = games × PF13.91/(PF13.91+PA13.91). The Lakers and Pacers show 83 games because the in-season tournament final counted in the standings; the rest played 82.
Worked example: Boston, which the model saw coming
Take the best team as a sanity check. Boston scored 9,887 points and allowed 8,957 over 82 games. Plug those in: 988713.91 divided by (988713.91 + 895713.91) comes out to 0.798. Over 82 games that is 65.4 expected wins. Boston actually won 64. The model missed the league's dominant team by 1.4 wins using nothing but two season totals. That is the whole pitch: when a team's point differential is enormous, its record is not luck, it is arithmetic, and Pythagorean reads it straight off.
What the residual actually is: close games
The interesting question is why the Lakers beat their differential by 4.6 wins and the Pistons fell short of theirs by 6.4. Pythagorean is blind to sequencing. It knows a team's total points but not how they were distributed across games. A team that loses three games by 30 and wins three by 2 has the same point differential as a team that split six blowouts — but a very different record. The residual, then, is almost entirely a team's record in close games, where a single possession flips a win to a loss without moving the differential much.
The numbers confirm it exactly. In games decided by five points or fewer in 2023-24, the Lakers went 18–6. The Pistons went 1–9. That is the entire mystery: the Lakers banked an extra handful of wins by winning the coin-flip games, and Detroit gave back a handful by losing them. Whether that is repeatable clutch skill or just variance is the exact question we chase in clutch time, quantified — and the honest answer there is that close-game records barely persist from one season to the next, which is precisely why Pythagorean treats the gap as noise to be regressed away rather than signal to be trusted.
Why anyone should care
Pythagorean is not a party trick, it is a bluntly useful forecasting tool. If a team's record sits well above its Pythagorean expectation deep into a season, the smart bet is that it regresses — its close-game luck runs out — not that it has discovered some sustainable winning gene. This is why it belongs next to the projection methods in how win-probability models work: point differential is the leading indicator, raw record the lagging one. A 41-win team outscoring opponents like a 47-win team is usually a 47-win team wearing a disguise, and the market that prices its next season should say so.
You can run the exact formula yourself on the Pythagorean win-percentage calculator — drop in any two point totals and watch the expected win% move. It is the same 13.91 exponent we used here.
Honest limitations
The exponent is fit, not handed down from nature. 13.91 is Morey's empirical best fit; Basketball-Reference often uses 14, and the "right" value drifts a little with the scoring environment. In a higher-scoring league the exponent that best separates good from bad teams shifts, and a stale exponent quietly biases every projection. It is a knob, and you should know it is a knob.
One season is a small sample for judging luck. With about 82 games, the standard deviation of the luck residual here is only about 2.6 wins — genuinely small — but that still means a team can miss its Pythagorean mark by five or six wins through pure schedule variance, as Detroit and Washington did. Do not over-read a single season's residual as a character flaw. Regression to the differential is the base rate; a specific team beating it once is well within noise.
Point differential can itself be distorted. Pythagorean trusts the differential, but the differential is inflated by garbage time and by blowout margins that don't map cleanly onto team quality. A team that wins tight and loses ugly will look worse to Pythagorean than it is; the reverse for a team that pads margins in decided games. The same distortion we unpack in how often an NBA game is actually close feeds straight into PF and PA here.
The takeaway
Give us two numbers — points for, points against — and we can reconstruct the NBA standings to within about two wins per team, no context required. That is not because basketball is simple. It is because, over a long season, the accumulation of scoring margin drowns out almost everything else, and what it does not drown out is the thin residue of close-game outcomes that no differential can predict. The Lakers won their coin flips and the Pistons lost theirs, and that — not some deeper truth the box score missed — is the whole gap between what those teams deserved and what they got.
Sources & Further Reading
- Game-by-game scores: bundled
data_layer/nba_home_results.csv(2023-24, 1,231 games; Basketball-Reference / public data). Season PF/PA and close-game records computed directly from final scores. - The Pythagorean exponent for the NBA (13.91): Daryl Morey's fit, as documented at Basketball-Reference, which also publishes expected W-L for every team.
- The original Pythagorean idea (baseball): Bill James, Baseball Abstract.
- Point differential and its relationship to winning: Dean Oliver, Basketball on Paper.