League-wide home-court advantage gets quoted as a single tidy number, and in 2023-24 it was modest — teams won about 8.6 percentage points more often at home than on the road. But that average buries an enormous spread. When I computed each team's home win% minus its road win%, the values ran from the Rockets at +32 points all the way down to the Grizzlies at −22 — a team that, improbably, won more often on the road than at home. One shared phenomenon, supposedly, and the team-by-team gap is 54 points wide. The honest catch, which I will get to, is that most of that spread is noise.
The finding, stated plainly
I took the bundled 2023-24 game results and, for every team, split its games into home and road and computed a win percentage for each. The home-court edge for a team is simply home win% − road win%, in percentage points. Do that 30 times and you get a distribution, not a single number. The league average edge is about +8.6 points — the typical team won roughly nine percentage points more of its home games than its road games. So far, so ordinary. The interesting part is how far individual teams sit from that average.
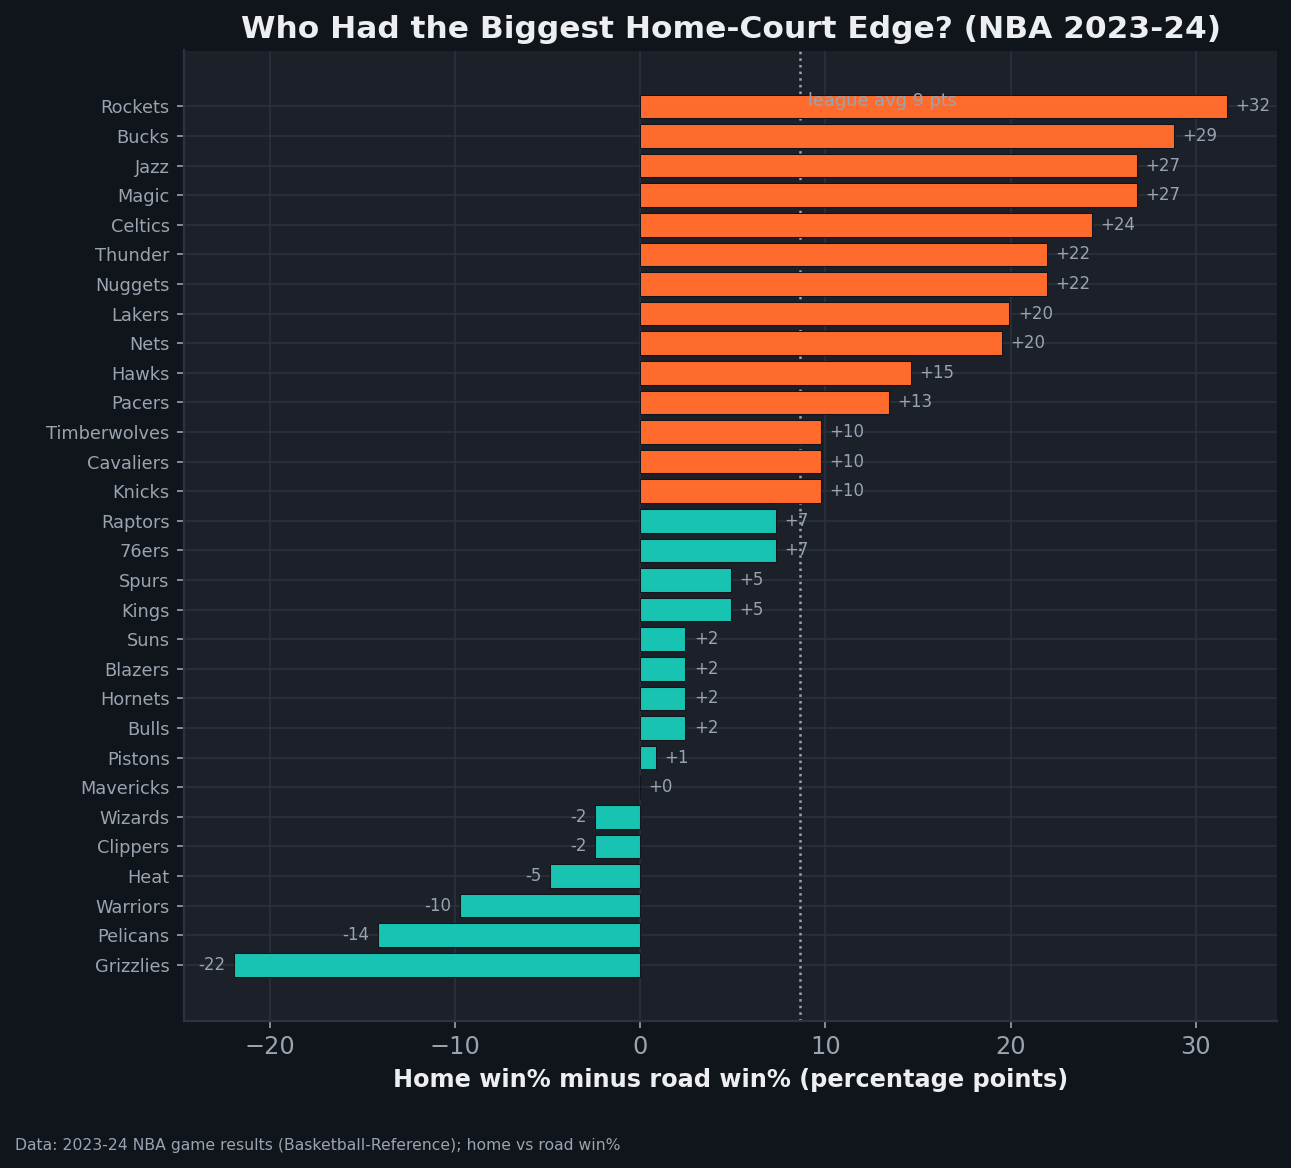
Read the chart top to bottom and the shape is clear enough: most teams cluster between 0 and +20, a comfortable home tilt that matches the folklore. But the tails are wild. The Rockets stretch out to +32, the largest home edge in the league. The Grizzlies fall off the bottom at −22, on the wrong side of zero entirely. The dotted line near +8.6 is the league average, and the striking thing is how few teams sit right on it. The “average” home-court advantage is a number almost no individual team actually had.
Worked example: the Rockets at +32
Take the team at the top. In 2023-24 the Rockets won about 66% of their home games and about 34% of their road games. The edge is the difference: 66 − 34 = 32 percentage points. That is not a rounding artifact or a quirk of one bad week — it is the single largest home-road split in the league.
It helps to translate percentage points into games. An NBA team plays 82 games split evenly — about 41 at home and 41 on the road. A 32-point gap means the Rockets won roughly two-thirds of those 41 home games but only about a third of their 41 road games: something like 27 home wins against 14 road wins from near-identical schedules of 41 apiece. Same roster, same season — the building they played in moved their win total by something on the order of a dozen games. Stated that way, +32 sounds enormous, because it is.
Now the other end. The Grizzlies posted a home edge of −22: about 22% at home, about 44% on the road. Read that twice — they were twice as likely to win away from home as inside their own arena. By the logic of home-court advantage, that should not happen, and it almost certainly did not happen for any reason worth naming. Memphis had an injury-wrecked 2023-24; its best players missed long stretches, and the team on the floor on a given night bore little relationship to the one penciled in before the season. Bury a roster under injuries and a 41-game home split becomes a coin landing on its edge — it can come up backwards, and for Memphis it did.
The honest catch: 41 games is a small sample
Here is the part I want to be loud about, because it is where this kind of chart gets abused. A team's home record rests on about 41 games, and its road record on the other 41. Forty-one is not a large sample. Win percentages built on 41 games swing around a lot purely by chance — a few close games breaking one way, a brutal stretch of opponents, a key player tweaking an ankle in March. When you then subtract two noisy 41-game win rates from each other, you do not cancel the noise; you stack it. The home-edge number for any single team in any single season is mostly luck wearing the costume of a finding.
So the extremes deserve suspicion rather than awe. The Rockets' +32 and the Grizzlies' −22 are real arithmetic from real games, but they are the loudest values in a noisy distribution — and the loudest values are exactly the ones most inflated by chance. Ask which teams had the biggest home edge this year and the biggest next year, and the lists barely overlap. The league-wide effect is stable and real — I worked through it game by game in home-court advantage: what the 2023-24 games show — but the team-by-team ranking is largely a snapshot of who got lucky at home.
Some of the spread is not noise, though. A handful of teams have genuine, repeatable reasons to play better at home: Denver and Utah sit at altitude, and visitors who land the night before are demonstrably winded late; Western teams absorb longer road trips by geography; a few arenas have unusual sightlines or rims the home team shoots against 41 nights a year and visitors see once. These effects are small but real and nudge certain franchises persistently upward. What they do not do is explain a +32 or a −22 — those magnitudes are luck riding on top of a small, genuine baseline.
What this measures, and what it doesn't
Two more limitations belong on the table. First, schedule quality is not identical home and road. A team might, by the luck of the calendar, host a cluster of weak opponents and visit a cluster of strong ones, or the reverse. Some of any team's home/road gap is just who it happened to play in each building, not the building itself — the same confound I chase through the strength-of-schedule work in NBA strength of schedule, 2023-24. Second, this metric measures an outcome, not a cause. Home win% minus road win% tells you that a team's results differed by venue; it says nothing about why — crowd, travel, rest, officiating, altitude, or plain variance all land in the same number, indistinguishable.
This is really a special case of a broader lesson about how little of a single NBA season is signal — I put rough numbers on that in how much of an NBA game is luck, and the same humility applies to which teams reliably perform, the genuinely steady ones being rarer than you would guess, as I found in the most consistent NBA teams. Separate the stable league-level effect from the unstable team-level estimate, and do not let a dramatic-looking bar chart talk you out of that distinction.
How it fits the field
None of this cuts against home-court advantage as a concept. The basketball-analytics consensus is settled on the league-wide point: across thousands of games, home teams win meaningfully more than half the time, and the effect persists across eras and even, in muted form, through the fan-less stretches of 2020. The same consensus is equally clear that situational splits — home/road, clutch, by opponent — are noisy at the team-season level and should be regressed hard toward the league mean before anyone reads a story into them. This is the spirit of Dean Oliver-style situational analysis: a split is a hypothesis, not a verdict, until you have checked whether it survives the sample size. A +8.6 league average over 1,231 games is trustworthy; a single team's +32 over 41 is a conversation starter, not a conclusion.
Reproducing it
Everything here comes out of one bundled file. Each team's home and road win% — and therefore its home edge — is computed from nba_home_results.csv, the same 2023-24 game-results table behind the league-wide piece, by grouping every game under its home team and its away team separately and taking the win rate in each split. The ranked horizontal bar chart, league-average reference line and all, is drawn by charts/chart_home_edge_by_team.py, which stamps its own provenance footer so the figure can never drift from the data that made it. The whole exhibit is a load, two group-bys, and a subtraction — which is exactly why I trust the arithmetic and distrust the extremes.
The takeaway
Home-court advantage in 2023-24 averaged about +8.6 percentage points league-wide — real, modest, and worth respecting. But the team-by-team version of that number sprawled from the Rockets' +32 to the Grizzlies' −22, a 54-point spread for what is supposed to be one shared effect. The lesson is not that some arenas are magic and others cursed. It is that 41 home games and 41 road games make a small, jittery sample, that subtracting two small samples amplifies the jitter, and that the dramatic tails of a one-season home-edge chart are mostly luck with a little structure underneath. Believe the league average. Take any single team's bar with a fistful of salt.
Sources & Further Reading
- Free textbook: Chapter 20: Game Strategy and Situational Analysis — the theory behind this, at DataField.dev.
- All figures computed directly from the bundled 2023-24 NBA game results (
data_layer/nba_home_results.csv), sourced from Basketball-Reference. Per-team home and road win% taken from home/away splits; home edge = home win% − road win%; ranked chart drawn bycharts/chart_home_edge_by_team.py. - The league-wide companion, computed game by game over all 1,231 contests: home-court advantage: what the 2023-24 games show.
- On treating one-season situational splits as noisy estimates rather than findings — the basketball-analytics consensus and Dean Oliver-style situational analysis; see also how much of an NBA game is luck.