Here is one of the cleanest relationships in basketball: tell me how many points a team outscores its opponents by per 100 possessions, and I can tell you almost exactly how many games it won. Across all 30 teams in 2023-24, regressing wins on net rating gives a slope of 2.33 wins per net-rating point and an r² of 0.95 — a fit so tight that point differential basically is the standings. The conversion rate is the league's version of baseball's “ten runs per win”: about 2.3 wins for every point you beat people by per 100. Lead with that, because everything else is detail.
The exhibit
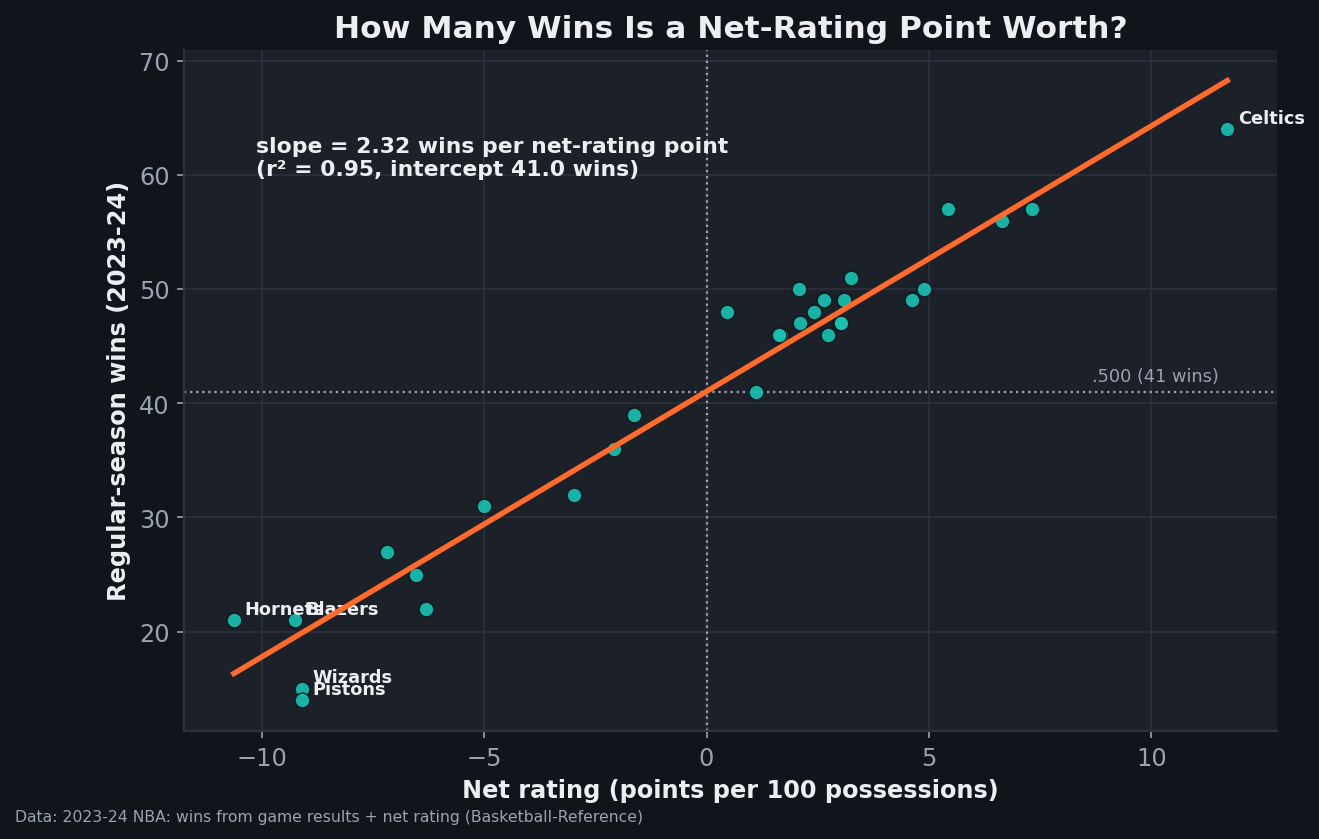
I counted each team's actual win total straight from the bundled game log and joined it to that team's season net rating. Plotted together, the 30 dots don't scatter — they line up. The regression line has three numbers worth memorizing: a slope of 2.33, an intercept of 41.0 wins, and an r² of 0.95. The intercept is the sanity check that makes the whole thing trustworthy: a team with a net rating of exactly zero — one that outscores opponents by nothing — is predicted to win 41.0 games, which is precisely .500 over an 82-game schedule. The model didn't have to land there. It did, because the relationship is real.
Working it through: Boston and Detroit
The cleanest way to feel a model is to run it on the two extremes. The Boston Celtics led the league with 64 wins at a net rating of +11.7. Drop that into the line:
41.0 + 2.33 × 11.7 = 68 wins predicted, vs. 64 actual.
Now the other end. The Detroit Pistons were the worst team in basketball at 14 wins and a net rating of −9.1:
41.0 + 2.33 × (−9.1) = 20 wins predicted, vs. 14 actual.
Both predictions miss by a handful of games, and they miss in a revealing direction: the model pulls the extremes toward the middle. It under-rates Boston's win total and over-rates Detroit's. That is exactly what you expect when you regress one noisy thing on another. The very best and very worst records are partly earned by quality and partly inflated by luck — a great team that also won most of its coin-flip games, a terrible team that lost them. Net rating captures the quality; it can't capture the luck, so it sensibly guesses that some of the 64th win and some of the lost 6 Detroit games were fortune rather than form. The residuals off the line aren't model failure. They're the part of the record that wasn't really about how good the team was.
What “2.33 wins per point” actually means
It's worth slowing down on the slope, because it's more intuitive than it looks. Over 82 games, lifting your net rating by a single point per 100 possessions — a small, steady edge, roughly one extra basket every couple of games — is worth about 2.33 wins in the standings by season's end. So the rules of thumb fall out cleanly: a team that outscores opponents by about +3 per 100 is a 48–49 win team (41 + 2.33×3 ≈ 48). Push to +6 and you're around 55 wins. The genuinely elite teams living at +10 to +12 are 64–68 win teams. A point doesn't sound like much on any given night; spread across a full season it's the difference between a play-in team and a real seed. This is the same logic that makes the value of a single possession add up to something enormous in aggregate, and it's why I trust net rating over the eye test when ranking teams.
The honest limitations
I want to be careful not to oversell that r² of 0.95, because some of it is a magic trick. Net rating and wins are, to a large degree, the same thing measured two ways. You win a game by outscoring your opponent; net rating is just outscoring opponents, normalized for pace and totaled up. So a tight relationship between them isn't a discovery about the universe — it's partly mechanical, the way a tight relationship between “total yards gained” and “points scored” would be. The interesting content isn't that they're related; it's the specific exchange rate (2.33) and how clean the intercept lands (41.0).
Beyond that, the metric has real soft spots:
- Blowouts inflate it. Net rating counts every point equally, so a team that wins by 30 in garbage time banks differential it can't convert to extra wins — a win is a win whether it's by 2 or 20. A team can pad its net rating without padding its record.
- Close games create the residuals. Two teams with identical net ratings can finish several games apart in the standings purely on how their one-possession games broke. Clutch execution and single-game luck live in the vertical scatter around the line.
- It's one season. Thirty data points from 2023-24. The shape is robust year to year, but the exact slope and intercept will wobble.
- The slope is era-specific. That 2.33 is tied to an 82-game schedule and this era's pace. Change the season length or how many possessions a game holds and the wins-per-point rate moves with it.
None of that overturns the headline. It just means net rating is a near-perfect description of a season and a slightly looser prediction of the next one — which is the right way to hold any one-season fit.
Where the idea comes from
This isn't my insight; it's an old one. Dean Oliver and the first wave of basketball analysts established decades ago that point differential is the single best predictor of future performance — better than win-loss record itself, because differential strips out the luck baked into close-game records. A team's margin tells you what its record is trying to tell you, only with less noise. The parallel to baseball is exact: the Pythagorean expectation, which predicts a team's record from runs scored and allowed, comes with its own “runs per win” conversion. Net rating to wins is basketball's version of the same machine, and 2.33 is its exchange rate. If you want the theory underneath — why efficiency per possession is the right unit in the first place — that's the subject of offensive and defensive rating, the two halves that net rating subtracts.
Reproducing it
Nothing here is hand-waved. For each of the 30 teams I counted its actual wins from data_layer/nba_home_results.csv — every game of the 2023-24 season — then joined each team's season net rating from nba_ratings.csv (sourced from Basketball-Reference). Regress wins on net rating and you get slope 2.33, intercept 41.0, r² 0.95. The chart and the fit are both regenerated by charts/chart_nrtg_to_wins.py, so you can re-run the whole thing and check my arithmetic. And if you're wondering why the better team still loses plenty despite all this, that's the natural companion question: how often the better team actually wins.
Sources & Further Reading
- Free textbook: Chapter 17: Team Offensive Efficiency — the theory behind this, at DataField.dev.
- Bundled data & chart script:
data_layer/nba_home_results.csv(every 2023-24 game) andnba_ratings.csv(Basketball-Reference net ratings), regressed and plotted bycharts/chart_nrtg_to_wins.py. - Conceptual roots: Dean Oliver, Basketball on Paper, on point differential as the best predictor of team strength; and the baseball parallel, Bill James's Pythagorean expectation and its runs-per-win conversion.
- Related: Offensive and defensive rating, how much of an NBA game is luck, and the value of a possession.