When I measured the corner three last month, one question stayed open. That piece priced the corner against the above-the-break three as if everything behind the top of the arc were one shot — and it is not. The shot file splits “Above the Break 3” into three zones: left wing, top of the key, right wing. Run the split on the 7,255 above-the-break attempts in the 25,000-shot sample and the top of the key is the worst-paying three on the floor: 34.6% and 1.04 points per shot, against 36.2% and 36.9% on the wings and 38.6% in the corners. But hold that headline loosely, because this article is mostly about how it survives scrutiny — and it only half does. The corner-versus-top gap is real at 2.7 standard errors. The wing-versus-top gap is 1.5 SE of maybe, and once you match distances, most of it dissolves.
The three-way ledger
Every attempt in the bundled file carries a BASIC_ZONE and a side-of-floor ZONE_NAME. Filter to three-pointers, drop backcourt heaves as usual, and the arc splits four ways — two wings, the top, and the corner baseline already published, recomputed here from the same file as a consistency check (it matches to the decimal):
| Zone | Attempts | Share of all threes | FG% | ±1 SE | Points per shot | Mean distance |
|---|---|---|---|---|---|---|
| Left wing (Left Side Center) | 2,803 | 28.5% | 36.2% | 0.9 | 1.09 | 25.8 ft |
| Top of the key (Center) | 1,788 | 18.2% | 34.6% | 1.1 | 1.04 | 26.0 ft |
| Right wing (Right Side Center) | 2,660 | 27.1% | 36.9% | 0.9 | 1.11 | 25.8 ft |
| Corner three (baseline, both corners) | 2,563 | 26.1% | 38.6% | 1.0 | 1.16 | 22.9 ft |
(The three zones sum to 7,251, not 7,255: four attempts launched from 41–44 feet carry the zone name “Back Court,” and they exit with the heave trim below.) Three readings. First, volume: the league does not treat these as one shot. The wings carry 55.6% of all three-point attempts between them while the top carries 18.2% — players shoot from each wing about one and a half times as often as from the top, which is roughly what the zone map would predict from the geometry of drive-and-kick offense. Second, the ordering: corner, wings, top — accuracy falls as you walk around the arc toward the longest part of the line. Third, the sizes: the corner out-shoots the top by 4.0 percentage points (SE 1.5, 2.7 standard errors) — the one within-arc gap in this file that clears the 2-SE bar. The wings out-shoot the top by 2.0 points (SE 1.3, 1.5 SE), which is a lean, not a finding. The house rule from the symmetry audit applies: differences under 2 SE get called what they are.
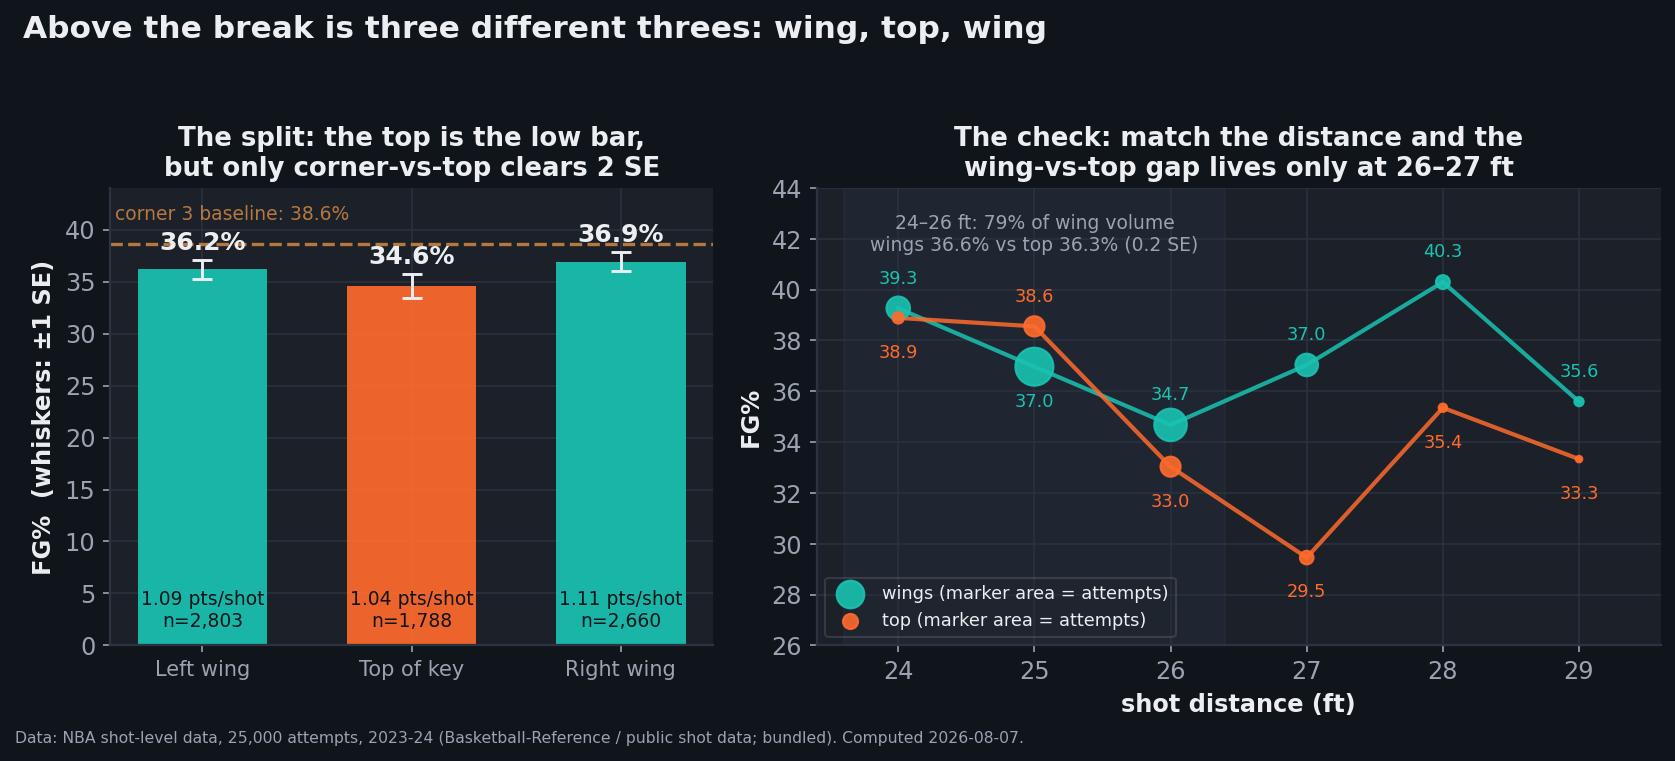
data_layer/nba_league_shots.csv (25,000 attempts, 2023-24; Basketball-Reference / public shot data). Charted by chart_wing_vs_top.py with a stamped provenance footer.Is it the zone, or is it the feet?
Before believing anything about the top of the key, check the suspect the corner piece already convicted once: distance. The arc is 23 feet 9 inches at the top and flattens toward 22 feet at the corners, so top-of-key threes should be longer — and they are, in two ways. Trim the 195 attempts from 30-plus feet (they hit 24.1%, and they spread evenly across zones: 58 left wing, 64 top, 69 right wing) and the average top-of-key three is still 25.83 feet against 25.62 on the wings. More telling is the tail: 24.2% of top attempts come from 27 feet and beyond, against 20.4% of wing attempts. The heave-trimmed gap is wings 36.79%, top 35.03% — +1.75 points at 1.3 SE.
So decompose it. Reprice the top of the key at the wings’ distance mix — take the top’s actual accuracy at each foot of distance, weight it by where wing attempts come from — and its 35.03% becomes 35.45%. Distance mix, in other words, pays back 0.4 of the 1.75-point gap and leaves a 1.3-point residual sitting at about one standard error. And the residual is not spread evenly across distances — it lives almost entirely in one band:
Walk the feet and you see it. At 24 feet: wings 39.3%, top 38.9%. At 25 feet the top is actually ahead, 38.6% to 37.0%. Then the floor tilts: 33.0% against 34.7% at 26 feet, and at 27 feet the top falls to 29.5% while the wings hold 37.0% — a 7.5-point crater that looks decisive until you notice it rests on 258 top-of-key attempts, and that it is one of six per-foot comparisons in a piece that already ran four zone comparisons. That is exactly the multiple-comparisons terrain where the symmetry audit taught us something is supposed to wander past the line by accident. A boring mechanical story would fit — a 27-footer from the top is disproportionately a late-clock pull-up over a set defense, while a deep wing three is more often a kick-out relocation shot — but this file carries no shot clock and no assist flag, so that is a hypothesis for a dataset I don’t have. What this dataset supports is narrower: the top’s deficit is a long-range phenomenon; at rhythm distances the wing and the top are the same shot.
Left wing versus right wing
The within-piece symmetry check, since the split hands it to us. Left wing 36.18% on 2,803 attempts, right wing 36.92% on 2,660 — a 0.74-point gap at 0.6 standard errors, i.e., nothing. That is the same null, on the same zones, that the left-right audit found when it mirrored the whole floor (its wing numbers were these numbers), and the corners told the identical story in the corner piece: 38.9 left, 38.2 right, 0.4 SE. Both wings also carry the same slightly heavier attempt load relative to the top. Whatever structure the arc has, it is radial, not sided — the floor still has no grain.
So which three should you shoot?
Priced per 100 attempts: corners 116 points, right wing 111, left wing 109, top of the key 104. The corner-versus-top spread — 12 points per 100 attempts — is now the widest arbitrage between three-point zones on the site’s books, and unlike the wing-top gap it is statistically solid. But the decomposition above says to read it the way the corner piece read the corner premium: as geometry collecting rent. The corner is a 22.9-foot shot, the top averages 26.0 feet, and accuracy falls about 0.8 points per foot across this range. A team’s shot-selection lesson is therefore not “avoid the top of the key” — at the distances that dominate real possessions, the top converts like a wing. The lesson is the same one the arc has been teaching for a decade, now with within-arc resolution: every foot behind the line is real money, and the extra feet players give away launching from 27-plus at the top are the most expensive feet in the file.
Limitations
One season (2023-24), and a bundled 25,000-shot sample of it rather than the league’s full attempt log — that is why the wing-top question, which needs to resolve a 1–2 point gap, ends in an honest shrug while the 4-point corner-top gap resolves cleanly. Distances are integer feet. The zone boundaries are the data provider’s, not mine; “Center” spans roughly the width of the lane extended, so “top of the key” here includes straightaway threes generally. The matched-distance comparison conditions on where players chose to shoot — if defenses concede different shots in different zones, matching distance does not fully equalize shot quality, and with no defender or shot-clock context I cannot close that door. And all of this is league-aggregate: your favorite high-volume pull-up shooter is priced into these averages, not described by them.
Reproduce it
The whole piece is two groupbys and a reweighting:
import pandas as pd
df = pd.read_csv("data_layer/nba_league_shots.csv")
df = df[df.BASIC_ZONE != "Backcourt"]
atb = df[df.BASIC_ZONE == "Above the Break 3"]
print(atb.groupby("ZONE_NAME").SHOT_MADE.agg(["size", "mean"]))

sub = atb[atb.SHOT_DISTANCE <= 29]           # heaves out
w = sub[sub.ZONE_NAME.isin(["Left Side Center", "Right Side Center"])]
t = sub[sub.ZONE_NAME == "Center"]
mix = w.SHOT_DISTANCE.value_counts(normalize=True)
ft = t.groupby("SHOT_DISTANCE").SHOT_MADE.mean()
common = mix.index.intersection(ft.index)
print((mix[common] * ft[common]).sum() / mix[common].sum())
# 0.3545 — the top, repriced at the wings' distances (raw top: 0.3503)
chart_wing_vs_top.py runs the full version on every rebuild — the four-zone ledger, every difference with its SE, the heave trim, the reweighting, and the per-foot table — and prints every number quoted above.
Sources & method
- Shot-level data: 25,000 records with zone, side, distance, and outcome, bundled at
data_layer/nba_league_shots.csv(public shot data; sourcing notes indata_layer/SOURCE.txt). This is a sample of the 2023-24 season, not the full league attempt log. All figures computed 2026-08-07 bychart_wing_vs_top.py. - Method: three-pointers split by
ZONE_NAMEwithinBASIC_ZONE= “Above the Break 3”; corners from the two corner zones as baseline; PPS = 3 × FG%. Standard errors are binomial — √(pq/n) per zone, √(p₁q₁/n₁ + p₂q₂/n₂) for differences. The distance decomposition reweights top-of-key per-foot accuracy by the wings’ attempt mix over shots of 29 feet and in. - Court dimensions (23 ft 9 in arc, 22 ft corners): official NBA Rulebook.
- Further reading: Chapter 8: Shooting Efficiency Metrics, DataField.dev.
- Related on this site: the corner three, measured · is the NBA left-handed? · where the NBA actually shoots from · accuracy falls with distance.