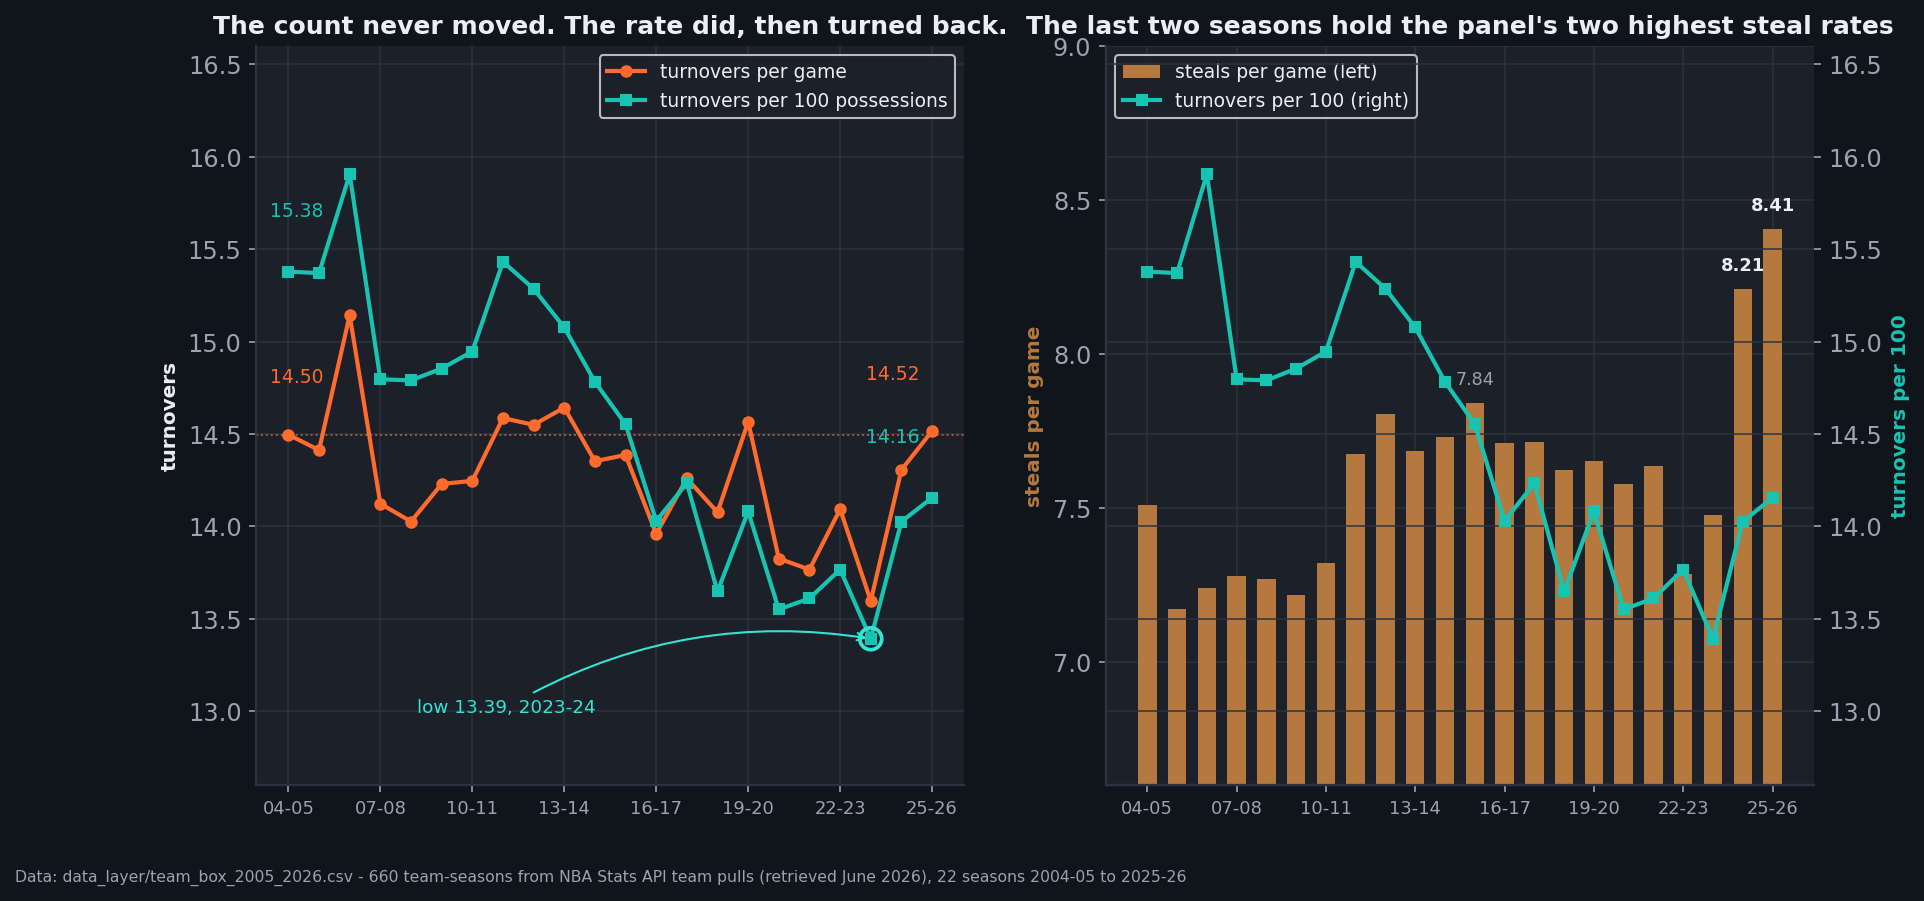
Twenty-two seasons ago the average NBA team turned the ball over 14.50 times a game. Last season it turned the ball over 14.52. Everything else about the sport moved — the three-point line swallowed the midrange, pace rose by more than eight possessions a game, assists went from 21.3 to 26.7 — and the number of times a team simply loses the ball has sat in the same place the whole time, to within one giveaway every fifty games. The rate fell, from 15.38 turnovers per 100 possessions to 14.16, but it fell because the denominator grew underneath a numerator that would not move. And in the last two seasons even that has reversed: the rate bottomed at 13.39 in 2023-24 and has climbed 0.76 since, while the league posted the two highest steal rates in the entire file.
The count and the rate are two different stories
The file is 660 team-seasons: every team, every season from 2004-05 through 2025-26, built from the league's own per-game team splits. Four of those seasons were not 82 games — the 2011-12 lockout, the one cancelled game in 2012-13, and the two COVID-affected years — and they are kept rather than dropped, because every figure here is a rate. The verification script checks that removing them changes no conclusion in this article, and it does not.
Read the raw count first. It has no trend worth the name. It sits between 13.60 and 15.14 for the whole span, and the two endpoints are 0.02 apart. There is no era in this file where NBA teams became careful with the ball.
Now read the rate, which is the number everyone actually quotes. Possessions per game went from 94.29 to 102.56 — eight and a quarter more chances a night — so dividing a flat count by a growing denominator produces a decline of 1.22 per 100 that has nothing to do with ball security. The turnover rate improved the way a batting average improves when you add at-bats and keep the hits.
data_layer/team_box_2005_2026.csv (660 team-seasons from the league's stats service, retrieved June 2026, built by data_layer/build_team_box.py). Charted and verified by chart_the_turnover_floor.py — 38 asserts.What did improve
There is a real skill story in this file, and it is not about turnovers at all. Assists went from 21.29 a game to 26.73, a gain of more than five, while turnovers stood still. So the assist-to-turnover ratio rose from 1.47 to 1.84, and that ratio is doing the work people usually credit to the turnover number.
That is a coherent picture of what changed. Offences learned to generate more passes that end in made shots. They did not learn to stop giving the ball away, and there is no obvious reason they should have: a turnover is the price of the pass that creates the assist, and an offence that stopped paying it would be an offence that stopped trying.
The reversal, and the part I cannot close
The last three seasons are the interesting ones. The turnover rate reached its 22-season low of 13.39 in 2023-24, then rose to 14.03 and 14.16. Over the same three seasons the league's steal rate went 7.48, 8.21, 8.41.
Those two 8s are the story. The highest steal rate in the eighteen seasons before them was 7.84, in 2015-16. The last two seasons clear that by 0.37 and 0.57 a game, which is not a nudge — it is the two highest readings in the file arriving back to back, after two decades of the number sitting in a band.
The tempting conclusion is that defences started taking the ball away and the turnover rate followed. I cannot support that from this file, and the reason is worth stating rather than hiding. Across all 22 seasons the correlation between the league's steal rate and its turnover rate is −0.30 — negative, not positive. That is not evidence that steals fail to cause turnovers; it is an artifact of two long trends pointing opposite ways, steals drifting up while the rate drifted down. The season-level correlation is measuring the trends, not the mechanism, and it should not be read as either confirmation or refutation.
What survives is narrower and still worth having: over the last three seasons both numbers moved up together, and the steal rate did something it has not done in twenty-two years. Whether that is a defensive change, a rule-enforcement change, or the start of a reversion from an unusually careful 2023-24 is not answerable from 22 league-season averages. It is answerable from the next two seasons, and this file will be here.
Two things to be careful about
The possession estimate is an estimate. Possessions here are the standard FGA + 0.44×FTA − OREB + TOV, where the 0.44 is a convention for separating real trips to the line from and-ones and technicals. It is not measured. The script re-runs every claim in this article at weights of 0.40 and 0.50 as well; the direction of the long decline and the identity of 2023-24 as the low hold at all three.
A league average hides the spread. Everything above is the mean across 30 teams. Within 2025-26 a team's own steal rate barely tracks its own turnover rate, which is what you would expect — the steals a team records are taken from its opponents, not from itself — and none of the season-level story should be read as a claim about any individual team.
The bottom line
The turnover rate is one of basketball's four factors and it is usually discussed as though it measures care with the ball. Over 22 seasons it mostly measured pace. The count underneath it has been flat since 2004-05, through three distinct offensive eras, and the only genuinely new thing in the file is happening right now: two consecutive seasons of steal rates no other season in the panel comes close to, with the turnover rate climbing behind them. That is either the start of something or the end of a quiet stretch, and the honest position after two seasons is that it is too early to say which.