The settled story about the bottom of the NBA is that it is a trap. Teams fall in, the losing compounds, and the climb out takes the better part of a decade — while at the other end, good teams are supposed to age gracefully, sliding down a long ramp. Lined up against 27 seasons of records, the ordering runs the other way. A team that finishes in the bottom five is back at .500 in a median of three seasons. A team that finishes in the top five takes five to fall below it, and 21 of the 130 top-five finishes in the file had not fallen by the end of it. That gap is not an artifact of picking teams at their extremes: a simulated league with symmetric dynamics, built from the persistence this site fitted three days ago, produces a gap of 0.13 of a season. The real one is 0.95. The NBA's floor is a revolving door and its ceiling is a slow leak, and only one of those is what chance would build.
The instrument, and why it is not an average
In each of the 26 seasons that have a season after them, I take the five worst records and the five best, then follow each team forward by its permanent franchise id, which links relocations. For a bottom-five team the event I am waiting for is a later season finished at .500 or better; for a top-five team it is a season finished below .500. That gives 130 cohort entries a side, and every one of the league's 30 franchises has finished in a bottom five at some point since 1999-00. Only two have never finished in a top five.
The obvious way to summarise this is to average the seasons each team took. That would be wrong in a direction that matters. Of the 130 bottom-five entries, 126 eventually crossed .500 and 4 ran out of file; of the 130 top-five entries, only 109 ever fell below .500 and 21 ran out of file. Averaging only the teams that crossed discards exactly the teams that make the point. So both sides are read with a Kaplan-Meier estimator, which keeps unfinished cases in the denominator for as long as they were observed.
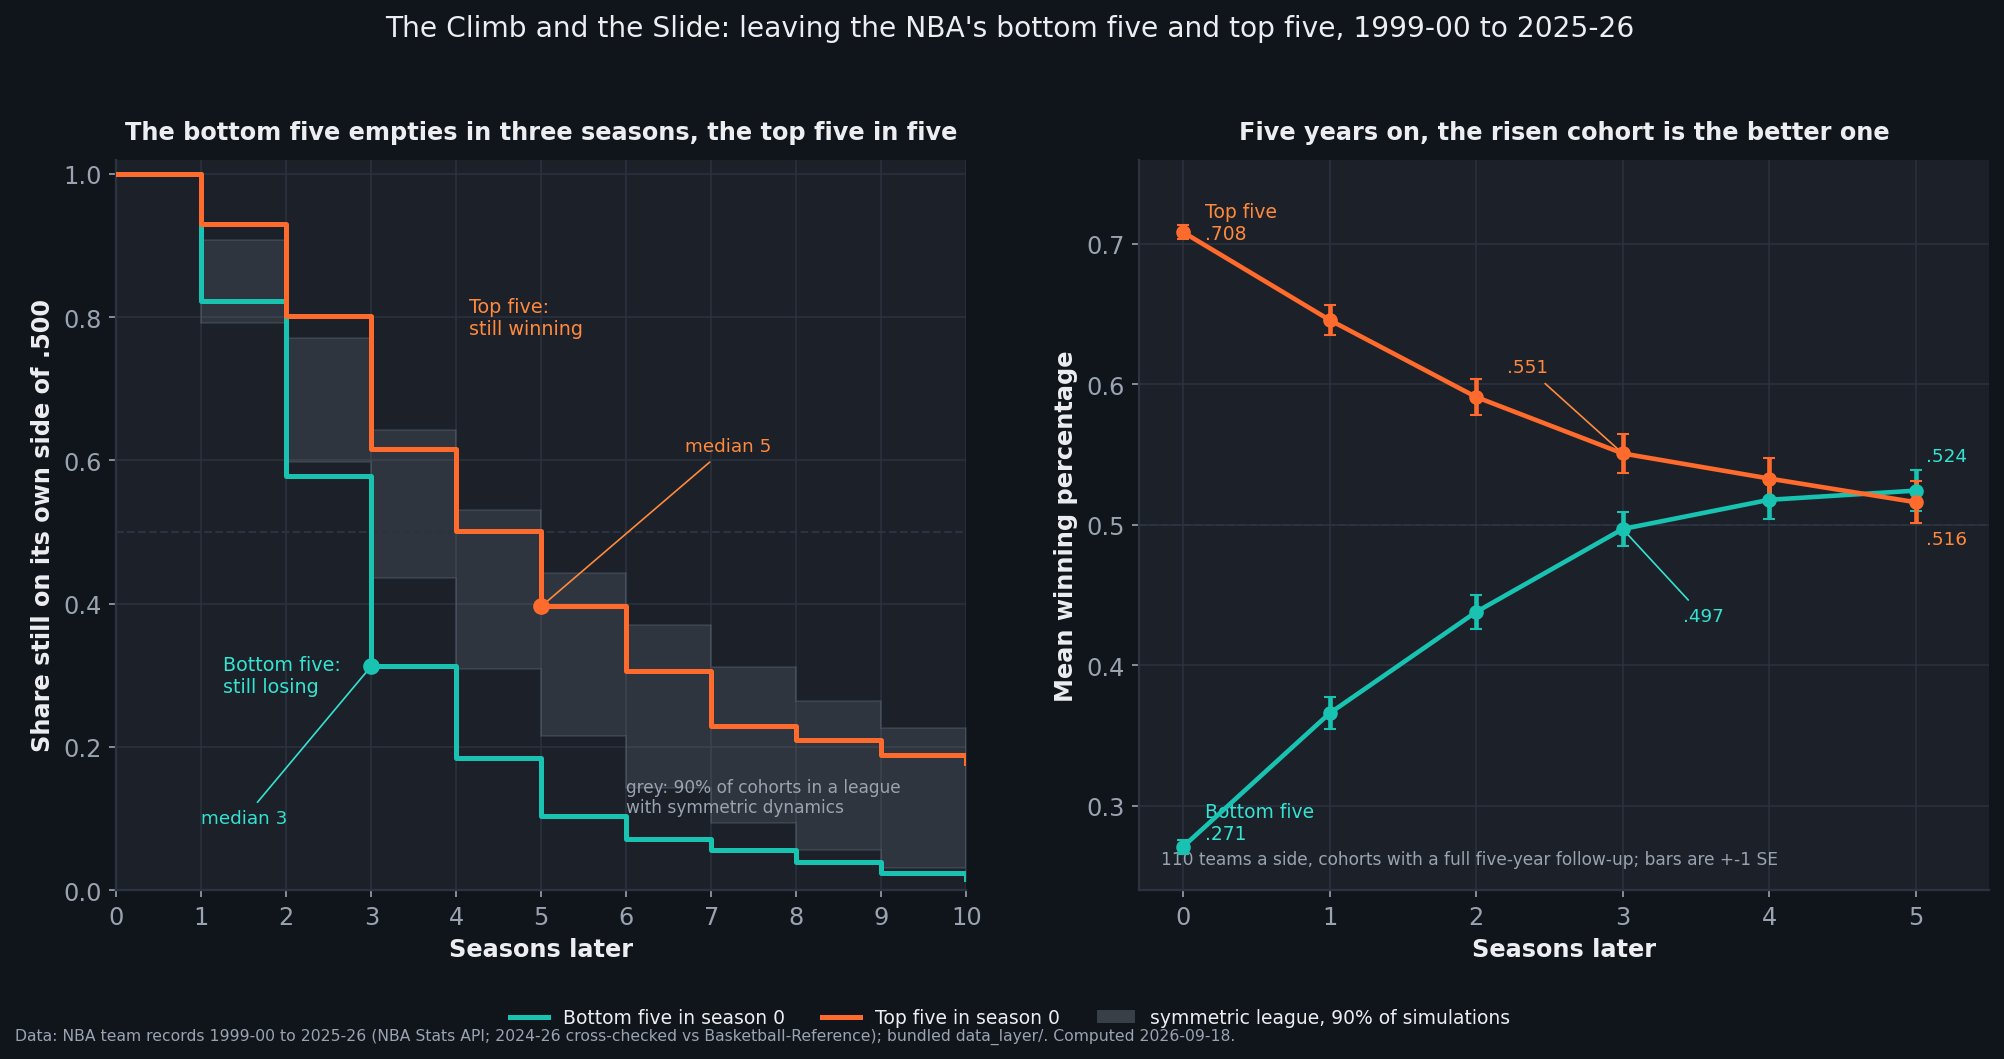
Here is the bottom-five curve by hand. In year one all 130 entries are at risk, 23 finish at .500 or better, and 3 are censored, so the share still losing is 1 − 23/130 = 0.8231. In year two 104 remain at risk and 31 cross, so the share falls to 0.8231 × (1 − 31/104) = 0.5777. In year three 72 are at risk and 33 cross: 0.5777 × (1 − 33/72) = 0.3129. The curve passes one-half during year three, which is the median. The same first step on the other side: 130 top-five teams at risk, 9 fall below .500, and the share still winning is 1 − 9/130 = 0.9308. Year one alone separates the two groups by a factor of two and a half — 17.7% of bottom-five teams are respectable immediately, against 6.9% of top-five teams collapsing immediately.
data_layer/team_seasons_2000_2026.csv (805 team-seasons from the league's stats service; 2024-25 and 2025-26 records checked against Basketball-Reference). Charted and verified by chart_the_climb_and_the_slide.py — 114 asserts.What the two curves say
The left panel is the pair. Five seasons out, 10.4% of bottom-five teams are still under .500 and 39.6% of top-five teams are still at or above it. The single summary I trust most here is the restricted mean survival time over five seasons — the average number of those five seasons a cohort spends on its starting side of the line. Bottom-five teams spend 2.898; top-five teams spend 3.852. The difference is 0.954 of a season. A log-rank test on the two curves returns z = 6.05, with 124 bottom-five crossings observed against 86.4 expected had the curves been the same, though I will come back to why that number flatters itself.
The right panel follows the money rather than the crossing. Restricted to the 22 cohort seasons with a full five-year follow-up, 110 teams a side, the bottom-five group averages .271, then .366, .438, and .497 — level with .500 in year three — and finishes at .524 in year five. The top-five group averages .708, then .646, .591, .551, and is still .516 in year five. By year three the risen group sits .048 of winning percentage closer to .500 than the fallen group, and by year five the two lines have crossed: the ex-bottom cohort is a two-wins-above-.500 team and the ex-top cohort a 1.3-wins-above-.500 team. Five years after the fact, it is slightly better to have been terrible than to have been excellent.
One detail cuts against the easy reading. The very edge is equally sticky in both directions: 48.5% of bottom-five teams are bottom five again the next season, and 49.2% of top-five teams are top five again. Whatever is happening, it is not that bad teams are quicker to leave the extreme. They are quicker to cross the middle once they leave it.
A league that cannot prefer a direction
The obvious objection is that none of this needs a mechanism. Pick teams at the extremes of a noisy measure and they will move back toward the middle; maybe the bottom simply has more room, or its teams are selected from a longer tail. The way to answer that is to run the identical cohort machinery inside a league that is symmetric by construction and see whether the gap appears anyway.
So I rebuilt the stable league from the parity piece, re-deriving both of its parameters here rather than copying them: teams carry 0.605 of their record from one season to the next, a record is 86.1% talent at 82 games, so underlying quality persists at 0.703, and the talent spread is 0.140 of winning percentage. Thirty teams, each keeping 70% of last season's quality and drawing the rest fresh, playing the real schedule lengths with every game a weighted coin — five thousand histories of 27 seasons, same cohorts, same curves.
That league produces bottom-five and top-five restricted means of 3.433 and 3.568 — a gap of 0.134 of a season, with a standard deviation of 0.225, which is the residue of selection and rounding rather than a real preference. The observed gap of 0.954 sits 3.65 standard deviations above it. Exactly one of the 5,000 simulated leagues produced a gap as large; the 99.9th percentile of simulated gaps is 0.790, still short of the real figure. On the chart, the grey band is where 90% of those simulated cohorts fall, and the real bottom-five curve drops below it from year three onward. This is the part I did not expect: the parity piece's model reproduces the league's era-level behaviour well, and it is wrong about direction. Balance swings symmetrically; the teams inside it do not.
Does it survive being poked
Cohorts of three instead of five give a gap of 0.822; cohorts of eight give 0.764. Raising the bar on both sides — asking a bottom-five team to reach 45 wins and a top-five team to fall under 37, so that neither is judged on a coin-flip season — gives 0.751. Rebuilding the cohorts on point margin rather than record, which is the less noisy instrument, and asking for a crossing of zero margin, gives medians of three and four and a gap of 0.631. Splitting the file in half, the gap is 0.800 among cohorts from 1999-00 to 2012-13 and 1.135 among cohorts from 2013-14 to 2024-25. Every cut runs the same way, and the recent half runs hardest.
The check that does not cooperate is the one-season version. Take all 774 consecutive-season pairs — whose year-over-year correlation of 0.606 reproduces the parity piece's 0.605 — and ask what share of a team's distance from .500 survives into the next season, matched on how far out it started. In the widest band, teams 20 to 35 points below .500 keep 58.5% of their deficit while teams equally far above keep 66.4%, which runs with the curves. So does the 15-to-20-point band, 45.9% against 67.0%. But the 5-to-10-point band runs hard the other way: 65.2% below against 38.0% above. Two of the four bands agree with the survival curves and two do not. A single season is too noisy an instrument for this question, and I would not have published the one-year test on its own.
What this does not show
Finishing last is not the same as choosing to rebuild. These cohorts are records, not intentions. The file has no payroll, draft position, roster age or transaction data, so while the lottery, rookie-scale contracts and the escalating cost of holding an aging contender are all plausible engines for an asymmetry of exactly this shape, I cannot test one of them here. Naming a mechanism would be a guess wearing a number.
The log-rank z is too confident. The same franchise appears in many cohorts, follow-up windows from neighbouring seasons overlap, and a good team's five-year path is one story counted five times. Treating 130 entries as 130 independent observations, as that test does, is wrong. Resampling whole franchises instead — 2,000 draws, each franchise's entire history in or out — puts the 95% interval on the 0.954-season gap at 0.43 to 1.41. It excludes zero, and it is roughly half as sure as the log-rank z implies. Take the interval.
Censoring is doing real work. Four unfinished cases at the bottom against 21 at the top is itself part of the finding, but it means the top-five curve's later years rest on a shrinking and increasingly self-selected group.
The bookkeeping has seams. Relocations are linked by franchise id, so Seattle becomes Oklahoma City and Vancouver becomes Memphis, but the 2002-03 move to New Orleans opens a new id, and the Charlotte id is a composite of the pre-2002 Hornets and the team that entered in 2004-05. The count of franchises that never reached a top five depends on that choice. Three seasons were shortened and the league went from 29 teams to 30 in 2004-05, which is why everything above is winning percentage rather than wins.
I ran a lot of cuts. Three cohort sizes, two thresholds, a margin version and an era split. Every variant points one way, which is reassuring rather than damning, but the individual p-values are not the ones a single pre-registered test would have produced. I would defend the direction and rough size of the gap, not its third decimal. And .500 is a convention: only because the harder 45-and-37-win bar behaves the same am I willing to lean on it.
Reproduce it
team_seasons_2000_2026.csv holds the 805 team-seasons. chart_the_climb_and_the_slide.py builds both cohorts, fits the Kaplan-Meier curves, runs the log-rank test, the 2,000-draw franchise-clustered bootstrap and 5,000 histories of the symmetric league on a fixed seed (20260918), re-derives that league's two parameters from the file rather than importing them, re-runs the provenance checks against the bundled ratings and game log and the cached Basketball-Reference standings, pins every number above with an assert — 114 of them — and draws both panels. It runs offline in about a minute.
Detroit is the clean illustration, because it ran the whole distance inside three seasons: 17 wins, then 14–68, then 44, then 60. The jump from 14 wins to 44 is .366 of winning percentage in one summer, and it is not a freak — 23 of the 130 bottom-five teams climbed to .500 in a single season. The other end of the ledger is San Antonio, which won 58 games in 2000-01 and did not finish a season below .500 until 2019-20, nineteen years later; when the fall finally came it took the Spurs to 22 wins, twice, before they won 62 in 2025-26. Both franchises are in the 2025-26 top five, and both were in a bottom five as recently as 2023-24.
Which is the useful way to read the current bottom five — Washington at 17 wins, Indiana at 19, Brooklyn at 20, Sacramento and Utah at 22. The base rate says roughly one of them is a .500 team next season and most are inside three. That is not optimism, and it is no claim about their rosters, which this file knows nothing about. It is what the last 27 seasons did, and the reason I would think twice before writing any of them off: the bottom has never held teams as long as the stories about it suggest.
Sources & Further Reading
- Team records, 1999-00 to 2025-26: NBA Stats API team tables via
nba_api(retrieved June 2026), bundled asdata_layer/team_seasons_2000_2026.csvand charted and verified bychart_the_climb_and_the_slide.py. 2024-25 and 2025-26 records cross-checked against Basketball-Reference standings pages, retrieved 2026-09-15. - Kaplan, E. L., & Meier, P. (1958). "Nonparametric Estimation from Incomplete Observations." Journal of the American Statistical Association, 53(282), 457–481. The estimator used for both curves.
- Mantel, N. (1966). The log-rank test for comparing two survival curves, introduced in Cancer Chemotherapy Reports.
- Tango, T. M., Lichtman, M., & Dolphin, A. (2007). The Book: Playing the Percentages in Baseball. The talent-and-luck split behind the persistence parameter.
- Related on this site: the parity pendulum, whose stable-league model is the null used here; the coach ledger, on reading franchise arcs rather than won-lost records; how much of an NBA game is luck; net rating and points to wins; and the margin creep, the within-season version of the bottom falling out.