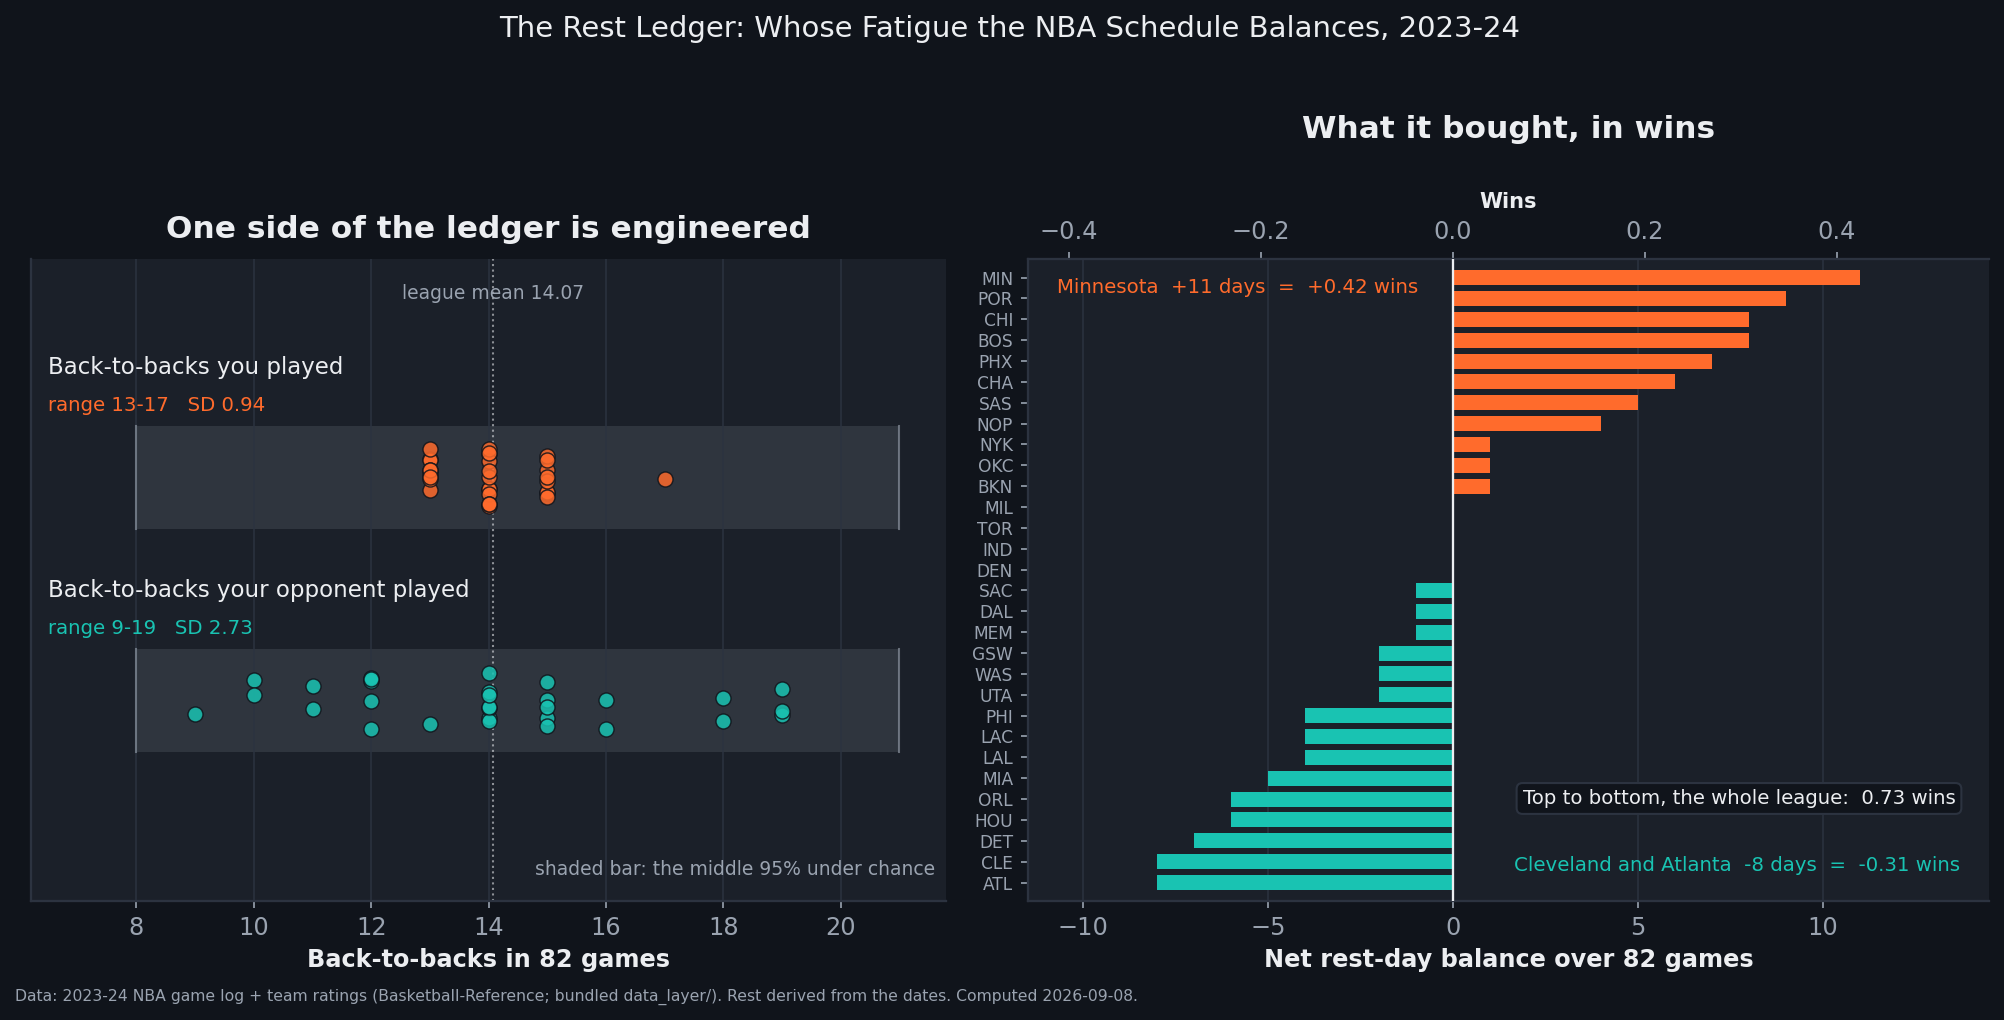
In June this site measured what a back-to-back costs and then waved a hand at the season: schedules are roughly balanced, so the penalty mostly washes out in the standings. That was an assertion, not a measurement, and it deserved a test. Here is the audit, and it turns out the balance is real but only on one side of the ledger. Reconstruct all 2,460 team-games of 2023-24 from the dates and every team played between 13 and 17 back-to-backs — a cross-team standard deviation of 0.94 against the 3.39 that random assignment produces, and not one of 20,000 simulated random schedules came out as tight. The number of opponents a team caught on a back-to-back ranged from 9 to 19, standard deviation 2.73, which sits comfortably inside chance. The league engineers the fatigue you suffer and leaves the fatigue you exploit to the draw. And the whole thing, priced properly, is worth 0.73 wins from the luckiest team to the unluckiest.
Two counts, one event
The measurement needs nothing the game log does not already hold. A team is on the second night of a back-to-back when it played the day before; its rest is the number of clear days since its last game. That is the same definition the back-to-back piece used, and we have kept it deliberately unchanged so the two articles can be read against each other.
Then take two counts per team over the same 82 games. The first is the familiar one: how many of your own games came on zero days' rest. The second is its mirror: how many of your games were played against an opponent on zero days' rest. League-wide these are the same 422 events seen from opposite ends, so both average 14.07 per team and both must total 422. The only thing that can differ is the spread — and the spread is the whole finding.
One housekeeping note that recurs on this site: the file carries 1,231 games, and the 1,231st is the 2023-12-09 In-Season Tournament final, Pacers at Lakers, 123–109, which counts in no team's 82. It is excluded here and every team then has exactly 82. Thirty team-games are season openers with no previous game; they pair off into exactly 15 opening-night games, which is why the priced regression below runs on 1,215 games rather than 1,230.
data_layer/nba_home_results.csv (1,231 real 2023-24 games) and data_layer/nba_ratings.csv. Charted and verified by chart_rest_ledger.py — 174 asserts.The own side is not a distribution. It is a rule.
Start with the tight strip. Thirty teams, 422 back-to-backs, and every single team lands in the five-value window from 13 to 17. Golden State played the most at 17; nobody played fewer than 13.
To know whether that is remarkable you need something to compare it against, so deal the 422 back-to-backs at random into 30 boxes of 82 games and see what spread falls out. Twenty thousand deals give a cross-team standard deviation averaging 3.39, with a middle-95% range of 2.53 to 4.29, and a single team's count wandering anywhere from 8 to 21 — the grey bar behind each strip in the exhibit. The real schedule's standard deviation is 0.94. Its variance is 8% of the chance variance, and zero of the 20,000 random deals came out as tight or tighter. This is not a distribution with a narrow tail. It is a constraint that has been satisfied.
We cannot tell from a game log whether that constraint is a written rule, a target handed to the scheduling software, or an emergent property of the other constraints the schedule has to satisfy, and we are not going to pretend otherwise. What the file supports is the observation, which is strong enough on its own: whatever the mechanism, the number of second nights each team plays is being controlled to within a couple of games.
The opponent side is a lottery
Now the other strip, which the schedule apparently does not care about. Houston played nine opponents who were on a back-to-back. Boston, Chicago and Portland each played nineteen. That is a ten-game gap in how often a team got the easy version of an opponent, and it is the mirror image of a quantity the league flattens to within four.
The chance benchmark here has to be built more carefully, because the opponent count is not free — it is downstream of everyone else's schedule. So the null holds each team's own back-to-back count fixed at what it really was and randomises only which of that team's 82 games those back-to-backs land on, then recounts everybody's opponent exposure. That is the exact question worth asking: given that the league controls how many second nights you play, does it also control who gets to play you on one?
Across 20,000 such seasons the cross-team standard deviation averages 3.39 — the same benchmark as before — and the observed 2.73 sits at the 7th percentile of that distribution. Slightly tighter than chance, then, and we would not build a theory on it: a range of 10 or narrower turned up in 6.4% of the simulated seasons. Set that beside the own-side verdict of zero in 20,000 and the asymmetry is not subtle. One count is engineered to a tolerance. The other is roughly what you would get by shaking the box.
What a rest-day is worth
Counting is only half of it. To turn the ledger into standings you need a price, so here is a plain game-level regression on the 1,215 games where both teams have a previous game: home margin on the net-rating gap between the two clubs and the difference in their rest, with rest clipped at three clear days because the All-Star break manufactures seven- and eight-day gaps that are not "rest" in any sense a coach would recognise.
A rest-day of differential is worth +1.33 points of margin (SE 0.44, t = 3.01). A point of net-rating gap is worth 0.95 points of margin (SE 0.05), and home court prices at +2.07 (SE 0.39). Residual standard deviation: 13.68 points, which is a reminder of how much of a single NBA game is not explained by anything. Swap the linear rest term for two dummies and a home back-to-back reads −2.88 (SE 1.06) against an away back-to-back's +2.51 (SE 1.03) — consistent, within their standard errors, with the ±2.77 the earlier piece measured by simple bucketing. The old numbers survive the model. So does the old bucket table: 1,700 team-games with both sides rested at exactly 50.0%, 114 with both tired at exactly 50.0%, and the 308 one-sided pairs at 41.9% and 58.1%.
Then the conversion to wins, computed from the same file rather than borrowed. Regress each team's 82-game win total on its average point margin and the line has an intercept of 41.000 wins — precisely .500, which is the sanity check the points-to-wins piece leaned on — and a slope of 2.3678 wins per point of margin, r² 0.963. One net rest-day is therefore worth 0.0385 wins.
Minnesota, worked end to end
Minnesota drew the best schedule in the league on this measure, and the arithmetic is short enough to print in full. Across their 81 priced games the Timberwolves had a rest edge in 23, a deficit in 14, and were level in 44. Net balance: +11 rest-days. They played 13 back-to-backs, tied for the fewest in the league, and caught 18 opponents on one.
Price it: 11 × 1.3338 = 14.67 points of expected margin over the season. Spread across 82 games that is 0.179 points a night. Multiply by 2.3678 wins per point and the schedule handed Minnesota 0.42 wins. They finished 56–26. The single luckiest rest schedule in basketball was worth four-tenths of one of those 56 wins.
The other end: Cleveland and Atlanta both ran −8, worth −0.31 wins. Boston, tied for the most tired opponents caught, also played 14 of its own and netted only +8 — 0.31 wins on a 64-win season. Houston, who caught the fewest tired opponents in the league at nine, came out at −6, or −0.23 wins, and finished 41–41. Top to bottom the entire league's rest luck spans 0.73 wins, with a cross-team standard deviation of 0.20. It correlates with actual win totals at r = 0.06, which is the reassurance that it is not quietly a quality variable in disguise.
So the old hand-wave was right, and it was right for a more interesting reason than "schedules are balanced." Schedules are balanced on the side the league controls. The side it does not control is worth so little per season that it does not need to be balanced.
The back-to-back is the famous half, not the bigger half
One thing surprised us. Of the 1,215 games, 538 — 44.3% — carried some rest gap between the two teams. Only 308 of those were the one-sided back-to-back everyone talks about. The other 230, 42.8% of all rest-gap games, involved no back-to-back at all: one day against two, two against three, the small asymmetries nobody mentions on a broadcast. The full game-level distribution of the gap runs 7 / 43 / 207 / 677 / 220 / 51 / 10 from −3 to +3.
Cleveland is the clean illustration. On back-to-backs alone the Cavaliers were almost level — 15 of their own against 14 caught, a differential of −1. On the full rest ledger they were tied for the worst in the league at −8, because they lost the one-day-against-two games again and again: 16 edges against 24 deficits. If you audit a schedule by counting back-to-backs, you are auditing 57% of it.
Home court is not rest
There is a real primary source behind the idea that these two things are connected. Oliver Entine and Dylan Small's "The Role of Rest in the NBA Home-Court Advantage" (Journal of Quantitative Analysis in Sports 4(2), 2008) is the paper that put rest into the home-advantage conversation, arguing that home teams tend to arrive fresher and that some of the home edge is really a rest edge wearing a disguise. It is a good question and this file can test the premise directly for 2023-24, so we did, and we are not reproducing their estimate — only running their question against one season of our own data.
Home teams averaged 1.084 clear days of rest; visitors averaged 1.053. That is a home advantage of 0.031 rest-days, t = 1.23, which is indistinguishable from nothing. Home teams were on a back-to-back in 16.7% of games and visitors in 18.0%. Priced at 1.3338 points per rest-day, the entire rest edge accounts for 0.04 points of the league's raw +2.15 home margin — 1.9% of it. Drop the rest term from the model entirely and home court moves from +2.07 to +2.11. In this season, at least, home-court advantage is essentially not made of rest.
What this doesn't prove
Four limits, and the first is the one that would change the conclusion. The price is a single-season estimate with a wide interval. 1.33 points per rest-day carries a standard error of 0.44; the honest reading is "somewhere between about half a point and two and a quarter." Every win figure downstream inherits that. Minnesota's 0.42 wins is a point estimate whose 95% interval runs from 0.15 to 0.70 wins. It is small under every value in the range, which is why we are willing to publish the conclusion, but nobody should quote the decimals.
Second, the clip at three days is a judgement call. Leave the All-Star gaps in and the coefficient reads +1.13 on a t of 2.88 — same sign, slightly smaller, slightly weaker, which is what you expect when you feed a rest variable a fortnight of layoff and ask it to mean the same thing. The unclipped ledger correlates with the clipped one at 0.91 and reorders only the top: Portland edges ahead of Minnesota, +13 to +10. The finding does not live or die on the cap.
Third, rest is not fatigue. It is a proxy that ignores travel distance, time zones, altitude, and which players actually took the floor. A back-to-back with a cross-country flight and a back-to-back in the same building are one number here. And some of what the rest coefficient measures is not tired legs at all but load management — stars sitting out second nights, which is a real cost of the schedule and a different mechanism from the one the word "rest" suggests. The load-management piece is about exactly that trade.
Fourth, one season, and the opponent side is a lottery with only 30 tickets. Thirty teams is a small sample for a dispersion test, which is why the opponent-side result is reported at the 7th percentile rather than as a finding. Another season would move it. The own-side result, at zero in 20,000, would not.
Reproduce it
Everything above is arithmetic and two simulations over two bundled files. chart_rest_ledger.py recomputes every number in this article and pins each with an assert — 174 of them, including the earlier piece's bucket table, so tired-against-fresh still reads 41.9% on 308 team-games and both-tired still reads exactly 50.0% on 114, precisely as it was printed. The simulations are seeded, so the percentiles reproduce exactly. If the article and the data diverge, the script fails loudly.
The recipe, if you would rather write it yourself: sort each team's games by date, take the day difference minus one as rest, join each game's two rest values back together, count zeros from both ends, and regress. Ten lines. The simulations are another twenty.
What we take from this is a small correction to how schedule complaints should be read. When a coach says the schedule was unfair, the number he can point at — back-to-backs played — is the number the league has already flattened, and he is almost certainly within one or two of everybody else. The unequal quantity is the one nobody counts, and it is unequal because nothing is trying to make it equal. It is also, on a full season, worth about a third of a win, which is less than the noise in a single close game and roughly what one three-point swing moves. Strength of schedule lists rest as one of the things a complete model would weigh. Now it has been weighed, and the answer is that opponent quality is worth arguing about and rest is not.