Ask a fan when the NBA is at its best and you will hear April, when everything is on the line. Ask the scoreboard and you get a different answer. Across the 1,230 real games in the bundled 2023-24 file, the average final margin was 11.5 points in October and November and 13.0 from February through April — a creep of a point and a half, about 2.2 standard errors, in the direction of less competitive. Games decided by five or fewer fell from 29.3% of autumn to 20.4% of spring — nearly a third of the close games, gone. But split the schedule by who is playing and the creep turns out not to be a league-wide property at all. Games between two top-twenty teams drift up about a point, a move indistinguishable from noise. Games involving the league's bottom ten drift up two. The season doesn't get less competitive. The bottom falls out of it, on a schedule you can read off the calendar.
The creep, measured
Month by month, the mean final margin runs 11.15, 11.62, 12.35, 13.02, 13.29, 12.92, 12.90 from October to April. February is the peak; nothing after January ever returns to an autumn number. The share of games finishing at twenty-plus — the blowout rate — rises from 16.1% in autumn to 20.2% in spring, while the five-point-game rate falls from 31.5% in October and 28.8% in November to a floor of 17.8% in February. None of these monthly moves is large against its own error bars, which is why the honest test is the phase aggregate: 273 autumn games against 519 spring games gives the margin creep at z = 2.2 and the close-game decline at z = 2.7. Real, modest, and consistently signed — the season ages in one direction.
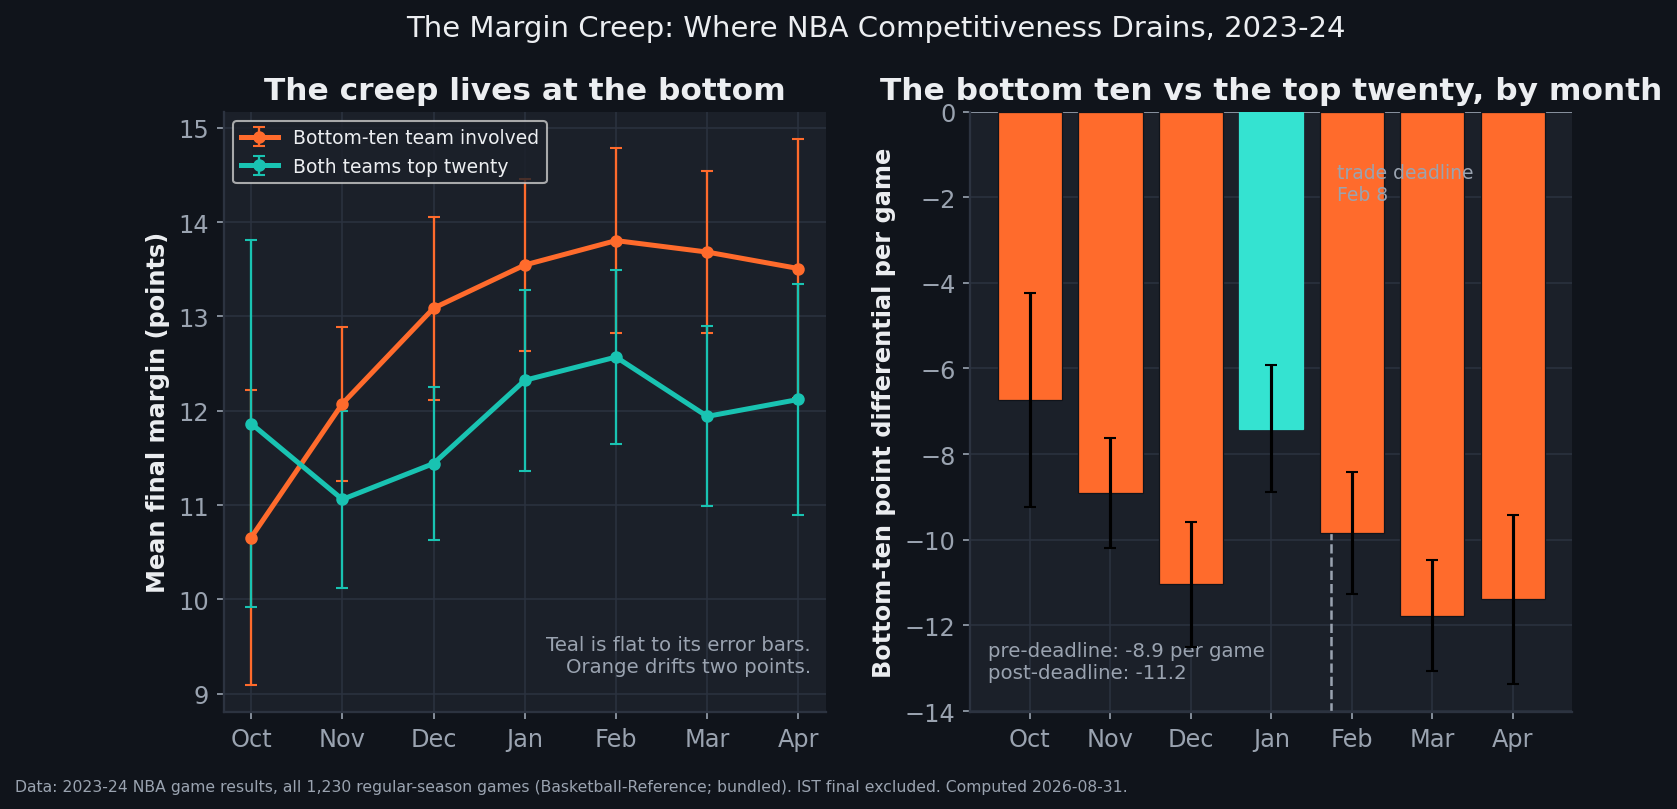
data_layer/nba_home_results.csv (all 1,230 real 2023-24 games; the In-Season Tournament final is excluded because it counts in no team's 82). Charted and verified by chart_margin_creep.py — 50 asserts.Where it lives
Rank the thirty teams by final record and call the ten below Atlanta's 36-46 line the bottom ten — the cut is clean, a three-game gap separating Chicago (20th) from Atlanta (21st). Now split every game by whether one of those ten is on the floor. Games without a bottom-ten team creep from 11.21 to 12.18 — less than one standard error of movement (z = 0.95), a shrug. Games with one creep from 11.78 to 13.69 — two points, z = 2.05. Restrict further to games between two winning-record teams (eighteen finished over .500) and you get 10.93 to 12.47, a 1.3-SE drift that direction-matches but doesn't clear the bar. Every slice of the schedule drifts a little; the only slice where the drift is distinguishable from noise is the one carrying the league's worst teams.
The favorite doesn't win more — it wins bigger
Here is the part that should adjust how you read spring standings. The team with the better final record won 66.9% of autumn games and 65.9% of spring games — the upset rate barely moves, which squares with the any-given-night curve. What moves is the size of the wins. Spring basketball produces the same number of upsets and much less suspense per game: the favorite's median evening gets easier even as its win probability holds still. The one month that breaks the pattern is December, when favorites won 74.3% — the highest of any month, in the same stretch when the East's playoff eight froze in place on December 16. The league's hierarchy announces itself early; what changes later is how loudly.
The deadline and the drain
Put the bottom ten under the lens directly: their 568 games against top-twenty opponents (the 126 games they played against each other are excluded — someone has to win those). Their per-game deficit runs −6.7 in October, −8.9 in November, and then does something instructive: it dips to −11.0 in December, rebounds to −7.4 in January — their best month, 29.1% wins — and then goes over the edge for good: −9.8 in February, −11.8 in March, −11.4 in April. Cut the season at the trade deadline, February 8, and the bottom ten lost to the top twenty by 8.91 before it and 11.19 after it — 2.3 points per game worse, about 1.9 standard errors — with their win rate in those games falling from 22.1% to 18.6%. The December dip and January rebound are a warning against reading any single month as a story; the phase-level slide is the part with statistical weight behind it.
Two slides and a bounce
The average hides the mechanism, because the post-deadline collapse is not a law of bad teams — it is a decision some of them make. Utah reached deadline day at 26-27, outscored by a trivial 2.06 points per game — a .500 team by any reasonable read — and went −10.07 per game the rest of the way, an eight-point collapse. Toronto slid from −3.29 to −11.61. Those two slides are the tanking window in its purest measurable form: teams that spent the season's first two-thirds competitive and its last third not. But San Antonio, 22-60, improved by 6.13 points per game after the deadline; Charlotte improved by 3.73; Detroit (−8.96 to −9.35) and Washington (−9.32 to −9.25) just held their level, because when you are already the floor there is nothing left to sell. The bottom ten's aggregate slide is really two or three franchises choosing spring over standings, averaged with everyone else's status quo.
What this doesn't prove
Four honest limits. First, this is one season; 2023-24 had a specific shape (a frozen East, a brutal West race), and the sizes here shouldn't be quoted as constants. Second, the file records scores, not rosters — it can show when Utah stopped being competitive, not whether the cause was trades, injuries, or veterans in warmups; the deadline cut is suggestive, not forensic. Third, final margin is a polluted measure of competitiveness: garbage time inflates it, and a five-point final can misdescribe the game that produced it — for the in-game version of "close," see how often a game is actually close. Fourth, April's close-game rate rebounds to 25.2%, which fits a nice story about the play-in dragging the middle back into meaningful basketball — but only ten April games matched two middle-tier teams, so that story stays a tease here rather than a finding. The In-Season Tournament final is excluded throughout; every team lands on exactly 82 games.
Reproduce it
Everything above is arithmetic over the bundled game log — data_layer/nba_home_results.csv, the same 1,230 real games behind the scoring arc and the win-style ledger. The build-side script that draws the exhibit, chart_margin_creep.py, recomputes every number in this article from that file and pins each one with an assert — 50 in all. If the article and the data ever diverge, the script fails loudly instead of letting the prose drift.
The practical reading is a caveat for anyone consuming spring box scores: a 15-point March win over a post-deadline seller is worth less information than the same margin in November, and the standings' final gaps are partly manufactured in their last two months. The season's verdicts are mostly in by the deadline. What follows is the league separating the teams that still want the games from the teams that want the summer.