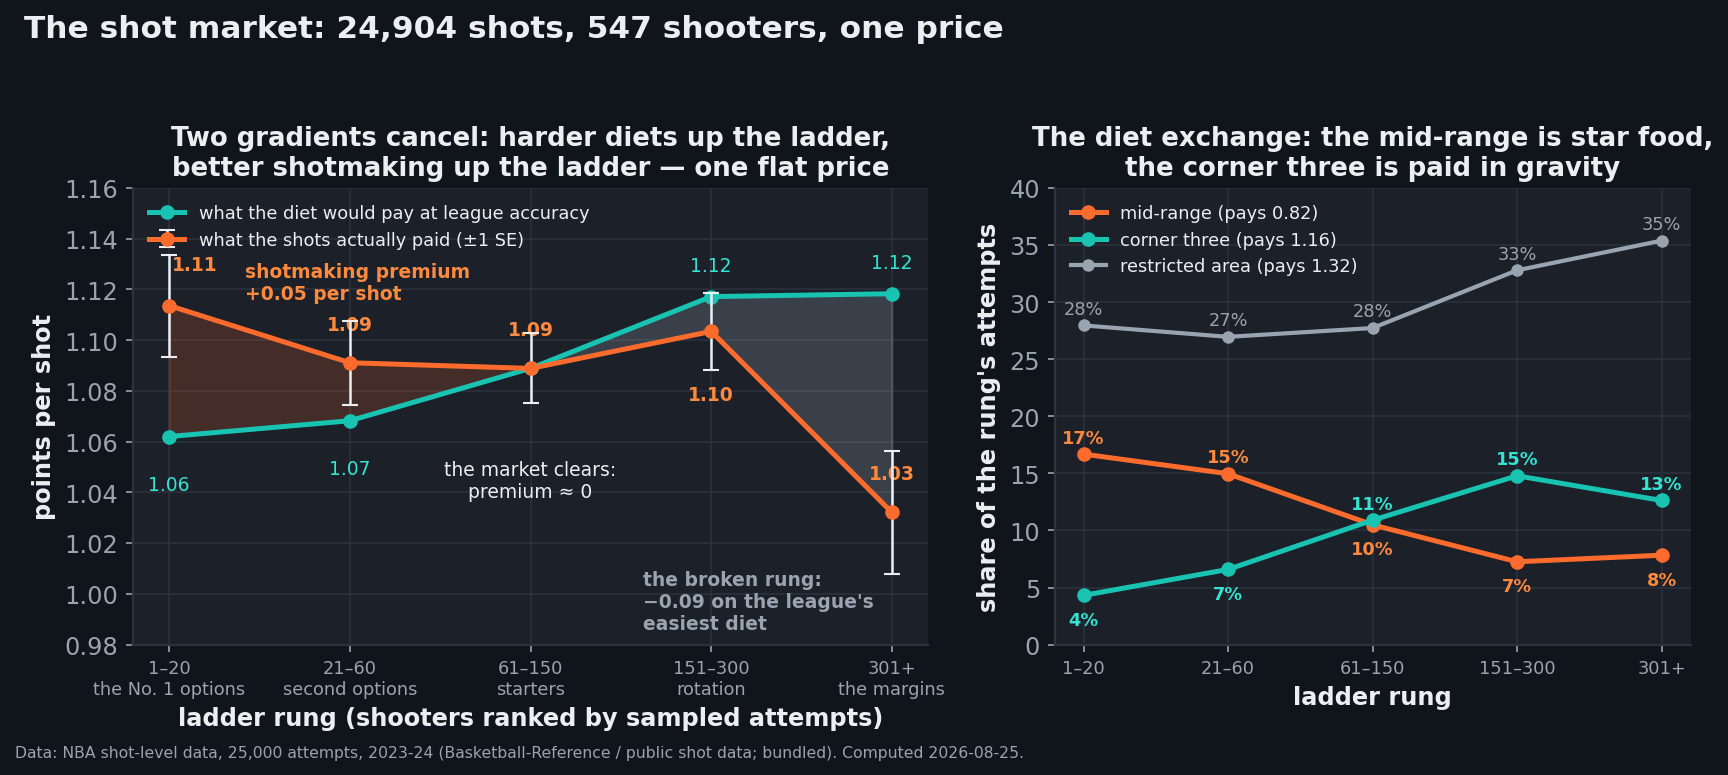
Here is a thing basketball's usage debate assumes and almost never checks: that stars pay an efficiency tax for volume, and that role players are efficient because they're protected. Rank all 547 shooters in the bundled 2023-24 shot file by how much they shoot, and the tax doesn't show up. The league's twenty heaviest shot-takers scored 1.11 points per shot. The next forty scored 1.09. The next ninety, 1.09. The next hundred and fifty, 1.10. Four rungs of a ladder that spans everything from Luka Doncic to a two-way contract, and the price of a shot barely moves. That flatness isn't an absence of forces — it's two enormous ones cancelling. Star shots are worth less by location and get made more often, in almost exactly offsetting amounts. The market clears. And then, on the fifth rung, it breaks.
The two prices of a shot
Every shot in this file has two values. The first is what its location is worth: the league shoots 65.8% in the restricted area (1.32 points per shot), 38.9% from the left corner (1.17), 36.2% above the break (1.09), 44.2% in the non-restricted paint (0.88), and 40.9% from mid-range (0.82 — the cheapest real estate in basketball, and not for the reason most people assume). Hand a league-average shooter someone's exact shot chart and that ladder of prices tells you what it should return. Call that the diet-expected value.
The second value is what the shots actually paid — makes and misses, counted. The gap between them is shotmaking premium: points per shot a player produced above or below what his shot locations were worth at league accuracy. It isolates the thing scouts argue about, because it has the location argument already subtracted out.
data_layer/nba_league_shots.csv (25,000 real 2023-24 shot records; the 96 attempts from 33+ feet are excluded as surrenders, per the heave). Charted and verified by chart_the_shot_market.py — 73 asserts.The scissors
The left panel is the finding. Read the teal line first: the shot locations get better as you descend the ladder. The twenty heaviest shooters take a diet worth 1.06 at league accuracy; the deepest rung's diet is worth 1.12. That is a six-hundredths-of-a-point gap in raw shot quality, and it is entirely earned — the right panel itemizes the exchange. Star rung: 16.7% mid-range, 4.3% corner threes. Deep rung: 7.8% mid-range, 12.6% corner threes, with restricted-area share climbing from 28.0% to 35.4%. Role players live on the two cheapest tickets in the building — the rim and the corner — because those are the shots a system manufactures for you. Stars eat the mid-range because someone has to take the shot the defense allows with four seconds left, and that shot is worth 0.82.
Now read the orange line, which runs the other way. On top-rung shots, the premium is +0.052 points per shot: the No. 1 options shot 42.6% from mid-range against the league's 40.9%, and 38.0% above the break against 36.2%. By rung three the premium is −0.000 — the market's exact clearing point, where a shooter's making is worth precisely what an average shooter's would be — and the two lines cross on the chart. Between those two facts sits the whole story: the star's harder diet costs him about five hundredths of a point per shot, and his shotmaking hands back about five hundredths. Net movement across four rungs and 22,567 shots: 1.114, 1.091, 1.089, 1.103. That's a flat line with a wobble smaller than its own error bars (standard errors of 0.014 to 0.020).
The broken rung
Then the fifth rung. The 247 shooters at the bottom of the load ladder — 9.4% of the sampled attempts, the last men in rotations — take the easiest diet in the league, worth 1.118, statistically indistinguishable from the rung above. They scored 1.032. That is a shotmaking deficit of −0.086 points per shot, more than five times the size of any other rung's gap and about 3.5 standard errors from zero.
The failure is specific rather than general, which is what makes it interesting. On the easy stuff, these players are nearly fine: 62.8% in the restricted area against the league's 65.8%. The collapse is at the arc — 29.8% above the break, against 36.2% league-wide — a 6.4-point hole on a shot that constitutes a quarter of their attempts. The end of an NBA rotation cannot shoot the shot the modern offense is built to generate. Everything else about the shot market is an elegant equilibrium; this is a cliff, and it is the honest answer to why coaches shorten rotations in May.
A worked example: three shooters, one price
Take the three heaviest loads in the file and follow the arithmetic. Jalen Brunson, 204 sampled attempts, took a diet worth 1.03 — heavy mid-range, the classic guard-who-must-score allotment — and scored 1.16: a premium of +0.12, though at a standard error of 0.08, treat that as "clearly positive, imprecisely sized." Luka Doncic, 195 attempts, diet 1.04, scored 1.07: +0.03. Stephen Curry, 186 attempts, diet 1.05 — the second-cheapest diet of the ten heaviest shooters, because the deep three is not a high-value location by league rates — and scored 1.34, a premium of +0.29 that is the largest in the file among 100-plus loads. Curry's case is the cleanest demonstration that these two numbers are measuring different things: his shot selection grades out as slightly below average, and he is the most efficient high-volume shooter alive, because he makes shots nobody else's arm is entitled to.
And the reverse exists in the same top ten, which is the part that keeps this honest. Damian Lillard: diet 1.09, scored 0.99, premium −0.10. Anthony Edwards: diet 1.07, scored 0.99, −0.09. De'Aaron Fox: diet 1.01, scored 0.96, −0.05. Three of the ten most-used shooters in basketball returned less than their own shot charts implied. The rung average is +0.05; the rung's membership includes both Curry at +0.29 and Lillard at −0.10. The market clears in aggregate and disagrees violently about individuals — which is exactly what a market does.
What this kills, and what it doesn't
The correlation between shot load and points per shot, across the 191 shooters with 50 or more sampled attempts, is +0.013. Zero, to three decimal places' worth of nothing. So the strong form of the usage-efficiency tradeoff — shooting more makes you worse — is not visible in this file at the player level, and neither is its inverse.
What survives, and what this analysis actually supports, is subtler and better: volume is paid for in shot quality, not in accuracy. Stars don't shoot worse when they shoot more; they shoot from worse places, and the good ones are good enough to make the arithmetic come out even. That reframing matters for how you read a box score. A 1.09-points-per-shot role player and a 1.09-points-per-shot star are not the same asset, because one of them produced it on a 1.12 diet and the other on a 1.06 diet, and only one of them can still produce it when the shot clock says three and the corner is covered.
The limits, stated plainly
Five of them, and the first two are load-bearing. This is a sample, not a season. 25,000 shots is 11.4% of 2023-24's 218,701 field-goal attempts — roughly one shot in nine — so per-player counts are sampled loads, not real ones, and every player number here carries a standard error near 0.08. The rung-level findings are far sturdier than any individual line: 2,337 shots on the thinnest rung, 7,663 on the fattest.
The ladder is built from sampled attempts, which means the rungs are noisy at their edges — a player at true rank 145 can land in the 151-300 bucket by sampling luck. That blurs the boundaries between rungs; it cannot manufacture the −0.086 hole on the last one, which is a 247-player aggregate. Zone prices are league-wide, not defense-adjusted: a contested corner three and an open one both get 1.16 here, and stars draw more of the contested kind, which means the diet gradient in the left panel is if anything an understatement of what stars face. Free throws and assists are outside this frame entirely — a driver who gets fouled instead of shooting simply vanishes from the file, and true offensive value includes the pass, which a shot-location dataset cannot see. And the 33-foot rule matters: excluding the 96 surrender heaves is a judgment call, made in the piece that established it; leaving them in moves the five rungs to 1.110, 1.087, 1.086, 1.098, 1.031 — every conclusion here intact, which is why the exclusion is a house rule rather than a thumb on the scale.
Reproduce it
The dataset is data_layer/nba_league_shots.csv, bundled with this site. chart_the_shot_market.py rebuilds every figure above from it and pins each one with an assert — 73 of them, including reproductions of the zone price sheet published in where the NBA actually shoots from and the surrender threshold from the heave. If the data and this article ever disagree, the script fails loudly rather than quietly. The diet-expected value is a two-line groupby: mean league points per shot by zone, then the mean of that quantity over a player's attempts. Primary sources for the framework this argues with: Dean Oliver's Basketball on Paper (2004) for the original usage-efficiency curve, and the shot-value literature that followed Kirk Goldsberry's spatial work; the disagreement here is empirical, not theoretical, and it is confined to what one season's sampled shots can support.
The next question this raises is one the file can't answer and the play-by-play could: whether the star premium is shotmaking or shot-quality-within-zone — whether Brunson's mid-range plus is a better jumper or a better-selected mid-range shot inside the same twelve-foot bucket. That's a tracking-data question. Until then, the honest summary is the one the chart shows: four rungs of a flat market, and one rung where the price of a shot falls apart.
Sources & Further Reading
- Shot-level data:
data_layer/nba_league_shots.csv, bundled with this site — 25,000 real 2023-24 field-goal attempts with zone labels and distances. Season attempt totals for the sampling rate:data_layer/nba_three_point_trend.csv. - The usage-efficiency framework this piece tests: Dean Oliver, Basketball on Paper (Potomac Books, 2004) — the origin of the usage-versus-efficiency curve and of possession-based team ratings.
- Zone definitions and league shooting baselines: Basketball-Reference Glossary.
- Reproduction:
chart_the_shot_market.pyrecomputes every figure above and pins each with an assert (73 in total, including the published zone price sheet and the 33-foot surrender threshold).