Every three-point percentage you have ever read has a footnote it rarely prints. When this site measured accuracy by distance, the source line said it plainly: backcourt heaves excluded. Every serious shooting analysis does some version of that, because everyone agrees a 60-foot fling at the quarter buzzer is not a jump shot. But excluded is not the same as measured, and the excluded pile turns out to have structure. The shot file holds 248 three-point attempts from 30 feet and beyond — 2.5% of all threes — and they went in at 20.2%. That number is a lie of averaging: it blends a real shot that hits 28.9% with a surrender that hits 6.2%, and the boundary between them is visible in the data to the foot.
The bucket nobody audits
Start with the ledger. The sample holds 9,875 three-point attempts, 3,607 makes, 36.5% — the same file behind the restricted-area cliff, binned here by distance from the rim:
| Distance | Attempts | FG% | ±1 SE | Points per shot |
|---|---|---|---|---|
| 22–23 ft (corners) | 2,184 | 38.8% | 1.0 | 1.16 |
| 24–26 ft | 5,938 | 36.5% | 0.6 | 1.10 |
| 27–29 ft | 1,505 | 35.9% | 1.2 | 1.08 |
| 30–32 ft (logo range) | 152 | 28.9% | 3.7 | 0.87 |
| 33+ ft (heaves) | 96 | 6.2% | 2.5 | 0.19 |
Through 29 feet, the slope is almost polite — 38.8% to 35.9% across seven feet, about 0.4 points per foot, exactly the gentle decay the distance article mapped. Then the floor gives out twice. From 27–29 to 30–32, accuracy drops seven points. From 30–32 to 33-and-beyond it drops another twenty-three. No other adjacent pair of bands anywhere on the arc is separated by more than three points; this one is separated by a cliff taller than the corner-to-logo fall in its entirety.
One bucket, two shots
The volume histogram gives the game away before the percentages do. Attempts per foot decay smoothly out to 32 feet — 90 at 30, 40 at 31, 22 at 32 — and then the arc simply ends: feet 33 through 39 hold 37 attempts combined, single digits at every foot, with nobody at all shooting from 36 more than twice. And then volume comes back: 59 attempts from 40 feet and beyond, more than the previous seven feet put together. Shot distributions do not grow a second hump because players gradually change their minds. They grow one because a different shot lives out there — the clock-forced heave, launched from wherever the ball happens to be when the buzzer approaches. The file's Backcourt zone tag says the same thing: its 53 attempts start at 42 feet and run to 78, and exactly 3 went in.
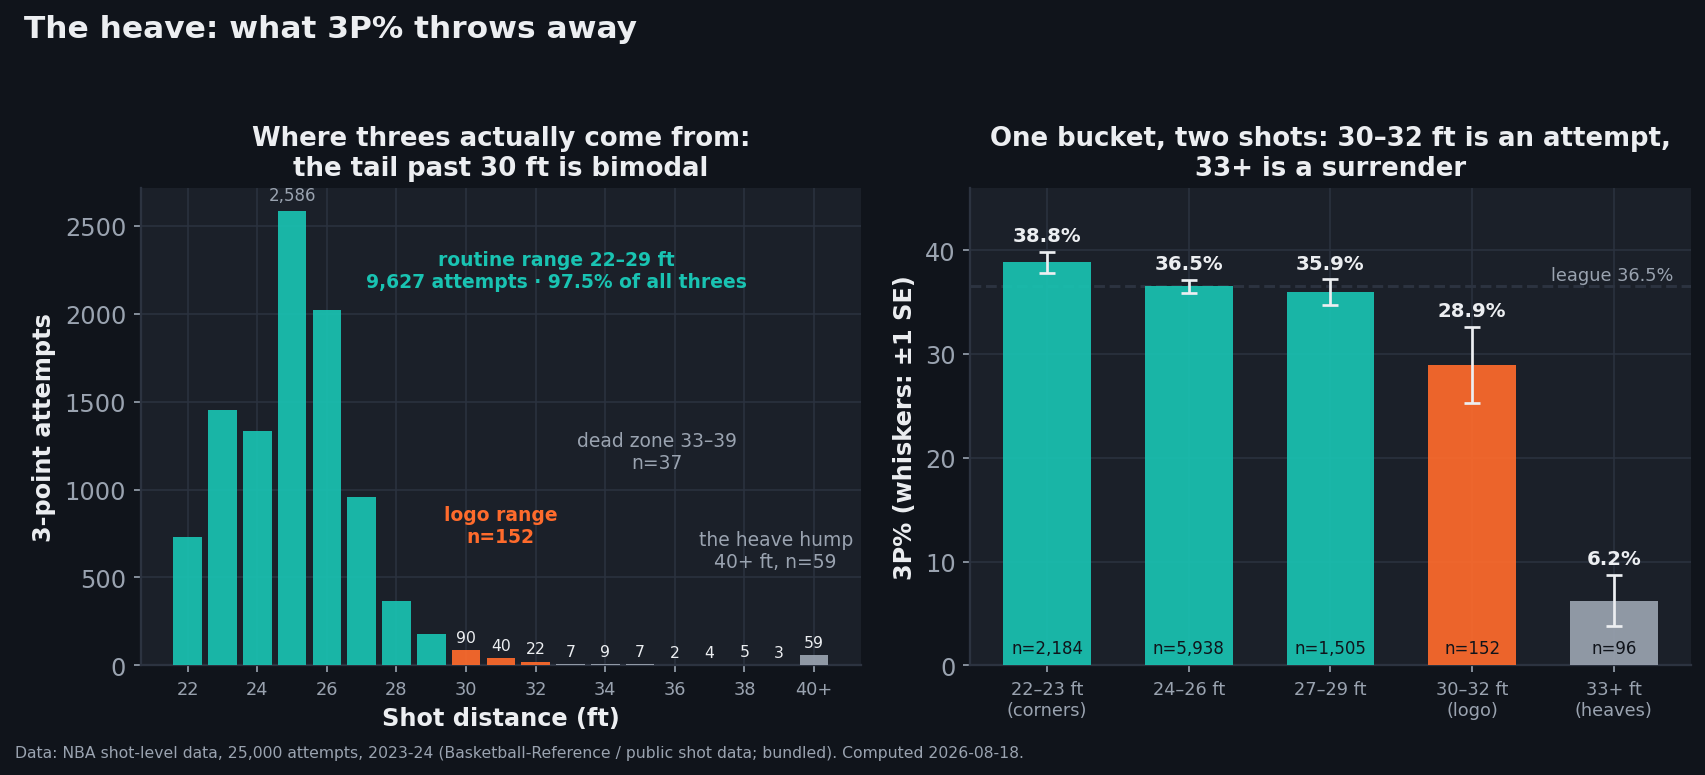
data_layer/nba_league_shots.csv (25,000 attempts, 2023-24; Basketball-Reference / public shot data). Charted by chart_the_heave.py with a stamped provenance footer.So the 30-plus bucket is two populations wearing one label. The logo three — 152 attempts, 30 to 32 feet — is a chosen shot: Stephen Curry has seven of them in this sample, LeBron James six, Max Strus five, Trae Young and Damian Lillard four each. At 28.9% it pays 0.87 points per shot, which is bad — worse than any routine three — but it is the same 0.87 neighborhood as the long two the league already tolerates (the distance piece booked that shot at 0.81), and late in a shot clock it is often the best offer left. The heave — 96 attempts from 33 feet out — pays 0.19 points per shot and is not competing with other shots at all; it is competing with the horn.
How much does the heave really distort 3P%?
Less than the folklore says, at league scale. Strike every attempt from 30 feet and the league line moves from 36.5% to 36.9% — four tenths of a point. Strike only the 33-plus surrenders and keep the logo threes, and it moves to 36.8% — which says nearly all of the distortion is the 96 true heaves, not the 152 deep attempts. A league-wide 3P% barely notices either way.
Player lines are where the bucket bites. The arithmetic is unforgiving at small n: a shooter who goes 35-of-100 posts 35.0%; the same shooter with three end-of-quarter heaves in the denominator is 35-of-103 — 34.0% — a full point of measured skill surrendered to team-context bookkeeping. That is why the sharpest incentive in this data belongs to the player, not the analyst: holding the ball through the buzzer costs the team an expected 0.19 points, but attempting the heave costs the player a percentage he is judged and paid on. The file has no shot-clock column, so we can't count late releases here — but we can count volume, and 59 attempts from 40-plus feet in a sample that spans roughly 280 team-games' worth of shooting (at the league's ~89 attempts a game) is a few percent of the quarter-endings that occurred. Most clock-expiring possessions produce no recorded attempt at all. The standing proposal in the analytics community — score buzzer heaves as team attempts, charged to no one — exists precisely because the current ledger punishes the rational act.
The six that went in
Ninety-six attempts from 33 feet and beyond produced six makes, and the list reads like a highlight reel because it is one: Nikola Jokic from 39, Trae Young and Max Strus from 33, Donte DiVincenzo from 44, Payton Pritchard — the league's most committed heave-taker by reputation, a perfect 1-for-1 past 33 feet in this sample — from 50, and Strus again from 58 feet, the longest make in the file. That last one is almost certainly the running buzzer-beater that won Cleveland the Dallas game in February 2024 — and Cleveland, fittingly, leads the sample in 30-plus attempts with 23, split mostly between Strus (8) and Darius Garland (7). A team that employs someone willing to shoot from 58 feet gets its reward roughly 5% of the time — about 15 points per hundred heaves that the percentage-protecting teams leave on the floor by eating the ball.
Where this site draws the line
The data suggests a cleaner exclusion rule than the one we inherited. Zone-based filters like backcourt excluded only catch attempts past half court — 53 shots here, all 42 feet or deeper — and let a 38-foot desperation fling stand as a real attempt. Distance-based filters at 30 feet overcorrect in the other direction: they delete Curry's and Trae's chosen shot along with the garbage. The seam the data actually shows is at 33 feet — the last foot before volume dies, the edge of the dead zone. So the house rule going forward: 33 feet and in counts as shooting; past 33 is a surrender, reported separately. The logo three stays on the books because it is a decision, and a 0.87-point-per-shot decision deserves to be visible — that is how the long two finally got audited out of existence. The heave stays off the books because nobody decided anything except that zero points was otherwise guaranteed. Fifty makes and 150 points in this sample were real; the possessions happened. But a percentage is a claim about skill, and only one of these two shots is making a claim.
Sources & Further Reading
- Shot-level data: 25,000 records with zone, distance, and outcome, bundled at
data_layer/nba_league_shots.csv(Basketball-Reference / public shot data; sourcing notes indata_layer/SOURCE.txt). This is a sample of the 2023-24 season, not the full league attempt log — band percentages past 30 feet carry the standard errors shown. All figures computed 2026-08-18 bychart_the_heave.py. - Related on this site: accuracy by distance (the piece whose exclusion footnote this article audits), the restricted-area cliff, and the corner three, measured.
- Basketball-Reference and NBA.com/stats for league-wide shooting context.