"Any given night" is the league's favorite insurance policy — the phrase that keeps blowout losers philosophical and ticket buyers hopeful. It is also a measurable claim, so let's measure it. Take all 1,230 regular-season games of 2023-24, label each game's "better team" by full-season record, and count. The answer has a clean headline: where the two teams were separated by at least five points of season win% — 933 of the 1,230 games — the better team won 70.8%. The worse team cashed the other 29.2%: not a miracle, roughly two games a night league-wide. And the insurance policy stays priced even at the extremes: across 281 games where the gap was thirty points or more — genuine mismatches — the doormat still won one game in six.
The curve
Bucket every game by the season-strength gap between its teams and the shape emerges:
| Season win% gap | Games | Better team won | ±1 SE |
|---|---|---|---|
| 0–5 points | 297 | 41.8%* | 2.9 |
| 5–10 | 163 | 56.4% | 3.9 |
| 10–15 | 159 | 54.1% | 4.0 |
| 15–20 | 119 | 77.3% | 3.8 |
| 20–30 | 211 | 74.4% | 3.0 |
| 30–45 | 250 | 82.4% | 2.4 |
| 45+ | 31 | 90.3% | 5.3 |
Read the trend, not the teeth: adjacent buckets sit within a standard error or two of each other (77.3 over 74.4 is noise, not a paradox), but the staircase from the mid-fifties to the low nineties is the real object. Ten points of season quality — about eight wins — buys surprisingly little on a single night; you need a twenty-point gulf before the favorite clears three-in-four, and even the forty-five-plus bucket, the widest mismatches a season produces, still leaks a loss in ten. That asterisk on the first row is not a typo, and it's the most instructive number on the page.
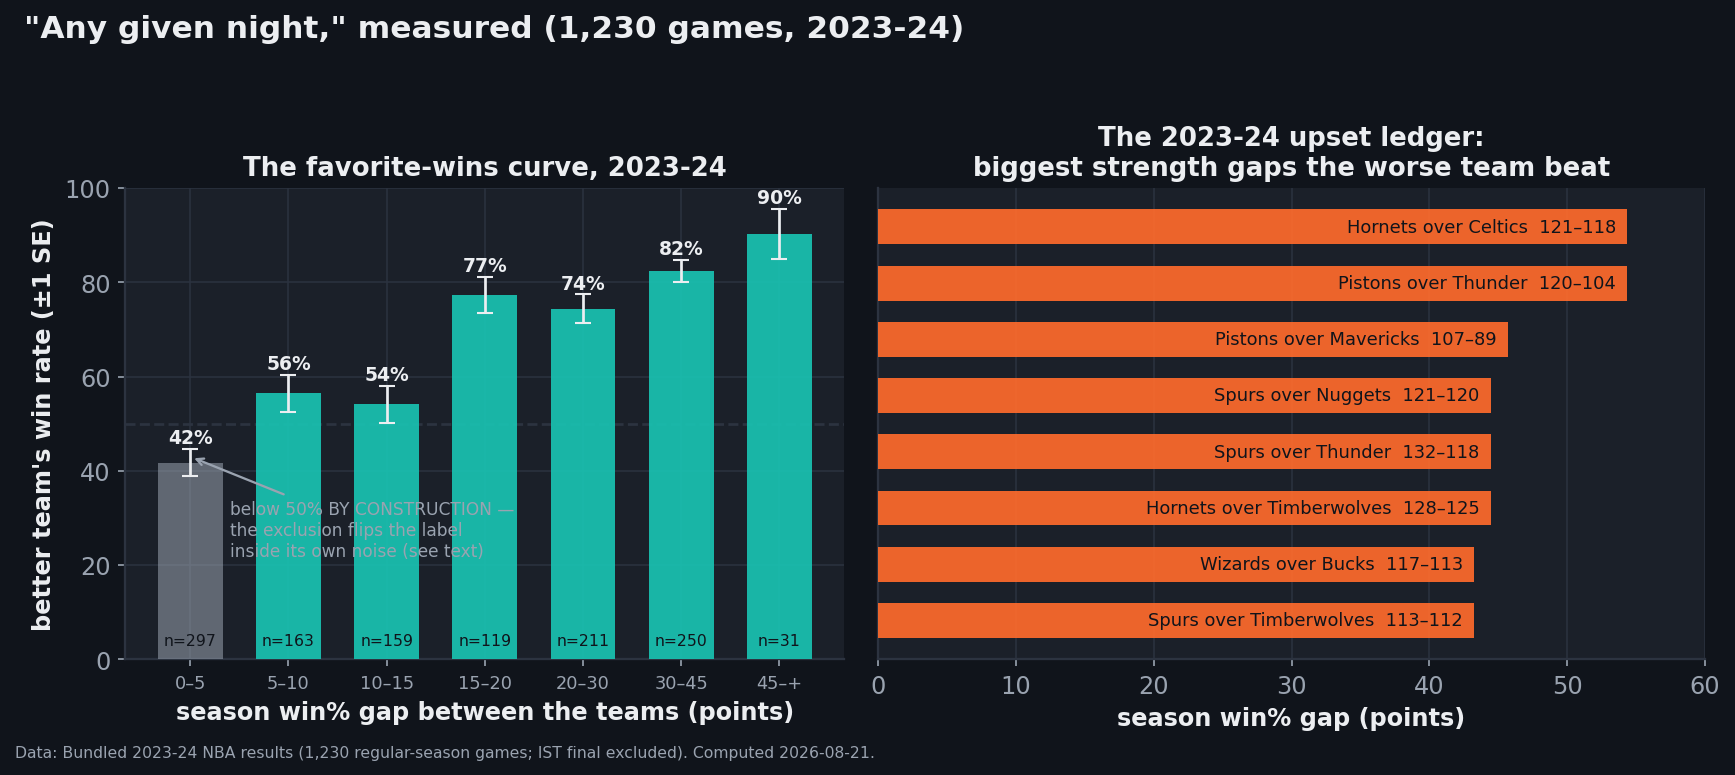
data_layer/nba_home_results.csv (1,230 regular-season games; the In-Season Tournament final is excluded so every team sits at exactly 82). Charted by chart_any_given_night.py.A methods confession: why the first bucket reads 42%
The "better team" label here uses each team's season record excluding the game being judged — the house yardstick, and the honest one, since letting a game vote on its own favorite is circular. But honesty has a visible cost. One game is worth 1/81 ≈ 1.23 points of win%, and the exclusion moves the two teams in opposite directions — the eventual winner's remaining record drops, the loser's rises — a combined swing of about 2.5 points. When the true gap between two teams is smaller than that swing, the exclusion itself decides who wears the favorite label, and it systematically hands it to the team that lost. Hence 41.8%: a below-coin-flip "favorite" manufactured entirely by the measurement. It's a tidy lesson in instrument error — a definition that is negligible at large gaps can dominate at small ones — and it's why every conclusion in this piece starts at the five-point line, where the label is stable.
The upset ledger
The right panel is the season's monument row. Top of the list, tied at a 54.3-point gap: the 21-win Hornets beating the 64-win Celtics 121-118 in November — Boston's full apparatus lost to a team that would win once a week — and the 14-win Pistons, mid-28-game-losing-streak era, handling the 57-win Thunder 120-104 in January. Not squeaking past: handling, by sixteen. Detroit appears twice in the top three; San Antonio appears three times in the top eight, including a 121-120 April win over the defending-champion Nuggets. One honest footnote on that one: two of the eight came on April 12, the season's final weekend, when contenders rest rotations — some upsets are scheduling artifacts wearing Cinderella's dress. The November Hornets game carries no such asterisk. It's just basketball's variance, arriving on schedule: at 90% favorite win rates, a 31-game bucket expects three earthquakes a season.
The favorite travels at a discount
Split the favorites by venue and the single-game home edge shows up exactly where you'd predict: the better team won 67.6% at home and 59.8% on the road — call it eight points of win rate for the building, consistent with the season-level home-advantage census. The practical reading: a mid-tier favorite on the road (the 10-15-point bucket, already soft at 54%) is barely a favorite at all, while the same team at home is a two-in-three proposition. "Any given night" is most true in someone else's arena.
What 71% actually means
Two framings, both correct. Framing one: NBA outcomes are heavily skill-determined — a 71% single-game favorite rate implies far less nightly chaos than most sports tolerate, which is why team-season records separate so decisively and why the playoff field forms early. Framing two: 29% is enormous. Across a 1,230-game season it means about 270 games went to the worse team — more than three a week, every week, all year. Both facts live in the same number because a single basketball game is about a 12-point-margin lottery ticket drawn from distributions whose means sit maybe 5 points apart; the margin distribution piece holds the machinery. The phrase survives because it's true often enough to remember and false often enough to bet against. The house edge, measured: 70.8.
Sources & Further Reading
- Game results: 1,230 regular-season finals bundled at
data_layer/nba_home_results.csv(the file's 1,231st row is the In-Season Tournament final, excluded here so all 30 teams sit at exactly 82 games). All figures computed 2026-08-21 bychart_any_given_night.py; the favorite label uses season record excluding the judged game, with the small-gap contamination disclosed above. - Related on this site: home-court advantage, blowouts vs one-score wins, and the revenge-game myth (another folk claim, measured to zero).
- Basketball-Reference for season context.