Leading the league is impressive. Breaking the distribution is something else entirely. Most great seasons sit at the right edge of a bell curve, a step ahead of the chasing pack; a handful sit so far out that the curve no longer has a shape there at all. These are the ten seasons where one player didn't just win a category — he made the rest of the field look like it was playing a different sport.
What "improbable" actually means here
I'm not ranking the best seasons. Best is a value judgment, and we'd argue about it forever. Improbable is a statistical claim: how far a line sits from what everyone else was doing that year, and how unrepeatable it has proven since. A 30-point scoring season is excellent and happens most years. A 50-point scoring average has happened exactly once in seventy-five years and will, in all likelihood, never happen again. One of those breaks the distribution. That's the bar.
By that standard, the usual "greatest player" debates mostly drop away, and a stranger list takes their place — one built on rebounds, assists from impossible positions, triple-doubles sustained across a full season, and a record that I can actually quantify for you to the decimal. We'll get to that one last, because it's the only entry on this list where I have the live data to show you exactly how absurd the margin was.
The ten that broke the curve
Here is the list. Each of these is a well-documented historical line, so I'm stating them as the record books have them — no reconstruction required.
| # | Player | Season | The line |
|---|---|---|---|
| 1 | Wilt Chamberlain | 1961-62 | 50.4 PPG, 48.5 MPG |
| 2 | Wilt Chamberlain | 1960-61 | 27.2 rebounds per game |
| 3 | Russell Westbrook | 2016-17 | 31.6 / 10.7 / 10.4 — averaged a triple-double |
| 4 | Stephen Curry | 2015-16 | 402 made threes, unanimous MVP |
| 5 | Wilt Chamberlain | 1967-68 | led the league in total assists as a center |
| 6 | Dennis Rodman | 1991-92 | 18.7 rebounds per game at 6'7" |
| 7 | Nikola Jokić | 2021-22 | led the league in advanced impact metrics by a wide margin |
| 8 | James Harden | 2018-19 | 36.1 PPG, a 32-game 30-point streak |
| 9 | Tracy McGrady | 2002-03 | 32.1 PPG on a play-in roster |
| 10 | Magic Johnson | 1981-82 | rookie-era stat lines without a true position |
A few of these reward a second look. Chamberlain appears three times, which tells you something about an era with fewer teams, faster pace, and no one his size — and the assists entry is the strangest of the three, because leading the league in passing volume as a center is the basketball equivalent of a goalkeeper finishing top scorer. Rodman pulling 18.7 boards a night at 6'7" is a triumph of effort over physics. Westbrook averaging a triple-double across 82 games was supposed to be a relic of Oscar Robertson's era; he did it, then did it three more times. And Magic playing every position on the floor as a rookie-aged guard broke the idea that positions were fixed at all. Each of these is improbable in its own direction. But only one of them comes with a margin I can put a number on.
The marquee: Curry's 402
In 2015-16, Stephen Curry made 402 three-pointers. To understand why that number is on this list and not merely "the league lead," you have to look at who finished second. His own teammate, Klay Thompson — himself one of the great shooters in history — made 276. That's a gap of 126 threes between first and second place.
Sit with that for a moment. The distance from Curry to the second-best long-range shooter on Earth that year was larger than ninth and tenth place combined fell short of him — and it was itself nearly a top-30-all-time three-point season's worth of makes, just in the gap. First place usually beats second place by a few percent. Curry beat the field by almost fifty.
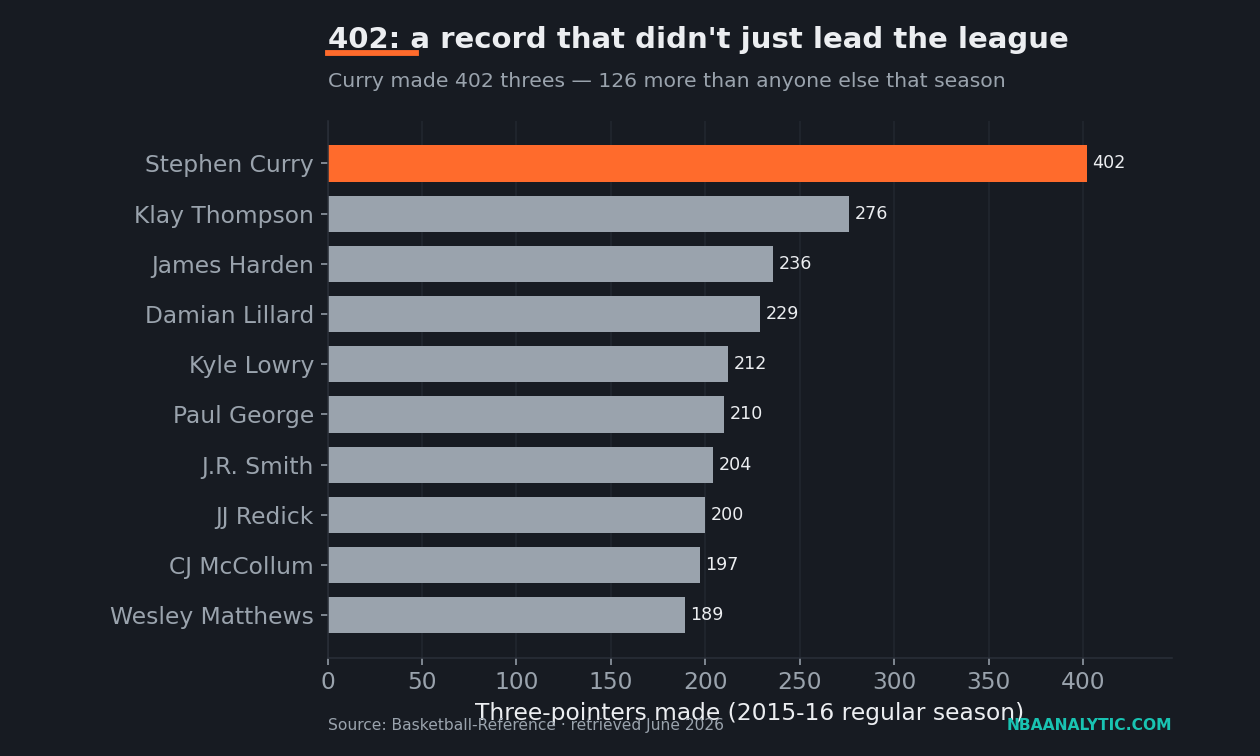
The rest of that season's top ten makes the point even sharper. Behind Thompson came James Harden (236), Damian Lillard (229), Kyle Lowry (212), Paul George (210), J.R. Smith (204), JJ Redick (200), CJ McCollum (197), and Wesley Matthews (189). Curry made more than twice as many threes as the player in tenth. He didn't lead a category; he relocated it. The previous single-season record was his own 286 from the year before, which means the most improbable thing about 402 is that the only person who had ever come close was him.
Why the margin matters more than the number
402 is a fun number, but the gap is the real story, because the gap is what makes a season improbable rather than just excellent. A record that beats the runner-up by two percent is a record waiting to be broken; the field is right there. A record that beats the runner-up by 46% has no field. It says the rest of the league had not yet figured out — or could not yet execute — what one player was doing every single night.
That's also why this particular season earned the only unanimous MVP award in league history. The voters weren't reacting to a counting stat; they were reacting to a distribution that had stopped making sense. It helped that the threes weren't empty volume — Curry's team won 73 games that year, the most ever. The shooting and the winning were the same event. If you want the longer story of how the entire sport reorganized itself around exactly this skill, I wrote about it in the three-point revolution; Curry's 402 is the moment that revolution stopped being a theory and became a scoreboard.
The takeaway
Most seasons we call "all-time" are a fast car at the front of the pack. The ten here are the ones that left the pack entirely — and Curry's 2015-16 is the one I can prove left it, by 126 makes, with the live numbers sitting right there in the chart. Leading the league means you were the best that year. Breaking the distribution means, for one season, the category was yours and the question wasn't who finished second — it was how far back second finished.
Sources & Further Reading
- Curry's 2015-16 three-point totals and the full top-ten leaderboard: Basketball-Reference (retrieved June 2026). The pull and chart are generated by
scripts/improbable_seasons.py. - League and player statistics: NBA.com/stats.
- The other nine seasons are stated as the historical record has them; treat them as well-known facts rather than fresh data pulls.