Every November the same thing happens: a player scores 25 for two weeks straight and the timeline declares a star is born. Sometimes it's true. More often it's a hot fortnight, or a role bump that inflated the counting stats without making the player any better. I've been burned enough times that I now run every "breakout" through the same four-part checklist before I believe it. Here's the framework, and here's what this season's data does to it.
The four signals
A real breakout is not one number going up. It's four things happening together, and the order matters because the last one is the part hot streaks can't fake.
One: the role got bigger. Minutes up, and more importantly usage rate up — the share of his team's possessions the player finishes with a shot, foul, or turnover. A scorer who jumped from 14 to 22 points but is playing the same role on the same team is usually just shooting hotter, and shooting variance regresses. A jump backed by genuinely more responsibility is something the player earned and the coach is choosing to keep feeding.
Two: the production followed. This is the obvious one — points per game up — but it only counts as evidence when it's riding on top of signal one, not standing alone.
Three: the efficiency held. This is the hard part, and it's the whole ballgame. As volume climbs, efficiency normally falls; defenses key on you, the easy looks dry up, and you start manufacturing tougher shots. So when a player adds eight possessions a night and his True Shooting percentage stays flat or — the dream — actually rises, that's the signal that the leap is real and not a mirage built on empty volume. Anybody can score more by shooting more. Scoring more per shot while shooting more is a different species of improvement.
Four: the shot diet is sustainable. Where did the new points come from? More threes and more rim attempts age well. A spike built on long two-point jumpers — the least efficient shot in basketball — is borrowing against a loan that comes due. The shape of the scoring tells you whether the efficiency in signal three is structural or lucky.
Why the efficiency signal is non-negotiable
The failure mode I'm guarding against has a tidy signature: volume up, efficiency down. A player gets handed a bigger role on a bad team, his points and usage both balloon, and his True Shooting quietly craters from, say, 58% to 52% because he's now taking every desperate possession the clock hands him. The box score screams breakout. The efficiency line tells you the truth — the team is scoring exactly as well with him doing more, which means he isn't actually doing it better. That's role inflation wearing a breakout costume, and the only column that exposes it is efficiency at the new volume.
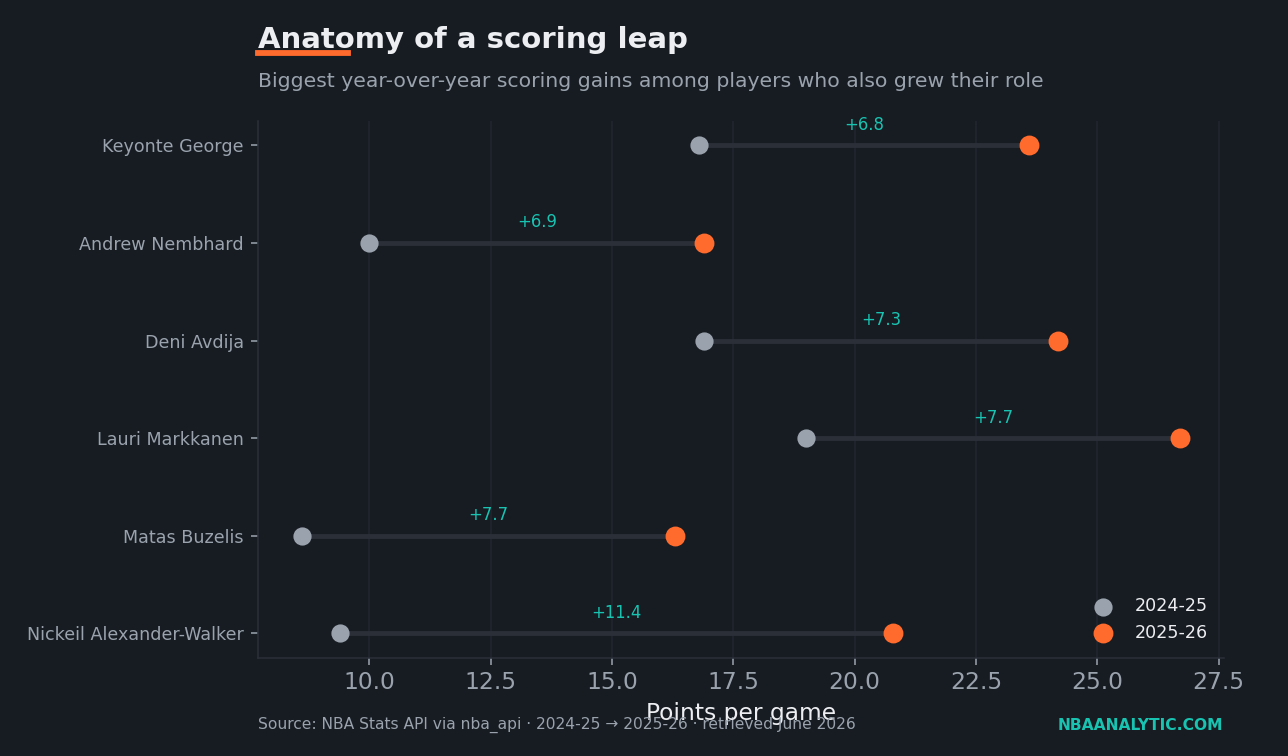
So the test is deliberately strict. I want the biggest year-over-year scoring jumps, but only among players who also grew their role and did not let their efficiency collapse to pay for it. Run this season's numbers through that filter and a short, honest list survives.
The headline case: Nickeil Alexander-Walker
The cleanest breakout on the board belongs to Nickeil Alexander-Walker, and it's a textbook of all four signals firing at once. His scoring went from 9.4 to 20.8 points — a 11.4-point jump, the largest in the group. Now run the checklist. Minutes climbed from 25.3 to 33.4. Usage rate exploded from 15.5% to 23.0%, which is the difference between a complementary connector and a genuine offensive option. So far that's just a bigger role, and a skeptic would stop there.
But here's signal three, the one that ends the argument: his True Shooting went up, from 57.9% to 61.0%. He nearly doubled his usage and got more efficient doing it. That is not what regression looks like; that's a player who was being underused. The leap came with the bigger role and the better efficiency, not in spite of them — which is exactly the combination a hot streak cannot manufacture, because a hot streak is by definition the efficiency running ahead of the role, not alongside it.
The full list, and one cautionary read
Five others cleared the bar. Keyonte George is the second-most striking: a 6.8-point jump that came with a True Shooting surge from 53.9% to 60.9%, the largest efficiency gain in the group — a leap in quality, not just quantity. Lauri Markkanen (19.0 to 26.7) and Matas Buzelis (8.6 to 16.3) both grew their role and nudged efficiency upward. Andrew Nembhard nearly doubled his usage, from 16.3% to 23.3%, and let his True Shooting rise with it.
Then there's Deni Avdija, who I'm keeping on the list precisely because he's the instructive borderline case. The scoring is real (16.9 to 24.2) and the role grew aggressively — usage from 22.8% to 28.5%, the biggest workload increase here. But his True Shooting dipped, ever so slightly, from 60.5% to 60.0%. That's the only efficiency line in the group that went the wrong way. It's a rounding error, not a collapse, and at that usage jump holding efficiency roughly flat is itself impressive — but it's a useful reminder of where the line is. Push the role harder than Avdija did without his shotmaking and that 0.5-point dip becomes a five-point dip, and you're looking at role inflation, not a breakout.
| Player | PTS prev→now | MIN prev→now | TS% prev→now | USG% prev→now |
|---|---|---|---|---|
| Nickeil Alexander-Walker | 9.4 → 20.8 | 25.3 → 33.4 | 57.9 → 61.0 | 15.5 → 23.0 |
| Matas Buzelis | 8.6 → 16.3 | 18.9 → 29.2 | 57.1 → 58.6 | 18.1 → 22.3 |
| Lauri Markkanen | 19.0 → 26.7 | 31.4 → 34.3 | 57.1 → 60.8 | 23.1 → 26.9 |
| Deni Avdija | 16.9 → 24.2 | 30.0 → 33.3 | 60.5 → 60.0 | 22.8 → 28.5 |
| Andrew Nembhard | 10.0 → 16.9 | 28.9 → 31.3 | 54.5 → 56.4 | 16.3 → 23.3 |
| Keyonte George | 16.8 → 23.6 | 31.5 → 33.1 | 53.9 → 60.9 | 23.7 → 27.5 |
The takeaway
The next time the timeline crowns a breakout, don't argue about the points. Ask the three follow-ups the points can't answer: did the role actually grow, did the efficiency survive the new volume, and is the shot diet one that lasts. Five of these six players answer yes on all three, and Alexander-Walker answers yes emphatically — a doubled role, more points, and better shooting all in the same season. That's what a real leap looks like. Everything else is just a good two weeks with good marketing.
Sources & Further Reading
- Chapter 22: Player Performance Prediction covers the foundations; it’s free to read at DataField.dev.
- Player scoring, minutes, True Shooting, and usage data: NBA.com/stats, pulled via the nba_api Python package (2024-25 and 2025-26, retrieved June 2026). The script is in
scripts/anatomy_of_breakout.py. - Stat definitions for True Shooting and usage rate: Basketball-Reference Glossary.