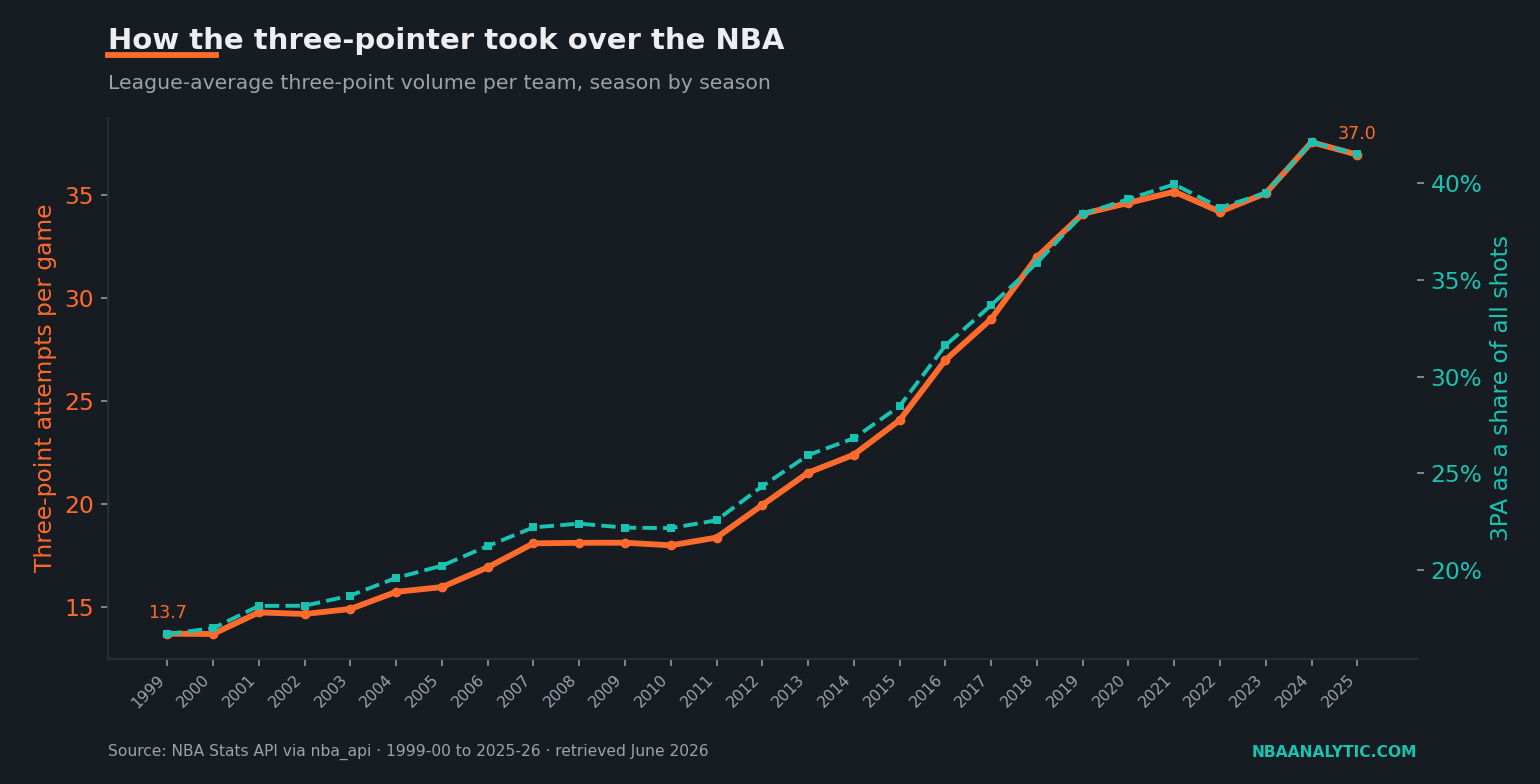
Some revolutions arrive with a manifesto. This one arrived with a spreadsheet. Over the past quarter-century the NBA quietly rebuilt its entire offensive geometry around a line painted 23 feet 9 inches from the rim, and the evidence isn't in the highlights — it's in the shot logs. Teams attempted 13.7 threes a game in 1999-00. This past season they attempted 37.0. That's not a trend. That's a different sport wearing the old jersey.
The number that changed everything
Start with the single statistic that tells the whole story. In 1999-00, the average NBA team launched 13.7 three-point attempts per game. By 2025-26 that figure had climbed to 37.0 — a 2.7-fold increase over a stretch in which the rules of the shot itself never changed. The arc didn't move. The math didn't move. The minds did.
The more revealing cut is share of diet. Back in 1999-00, threes made up just 16.7% of all shot attempts; roughly one shot in six came from distance. By this past season that share had ballooned to 41.5% — better than two of every five shots a team takes now originates behind the line. The mid-range jumper, once the staple of every wing's repertoire, has been zoned out of existence in favor of the layup and the three. There is no clearer fingerprint of a strategic regime change anywhere in the sport.
Why a three beats a two (the actual arithmetic)
The revolution wasn't aesthetic. It was arithmetic, and the arithmetic is embarrassingly simple. A three-pointer is worth 50% more than a two-pointer, so you don't need to make threes at the same rate you make twos to come out ahead — you need to make them at two-thirds the rate. The break-even line is exact:
When a three beats a two3P% > (2/3) × 2P%
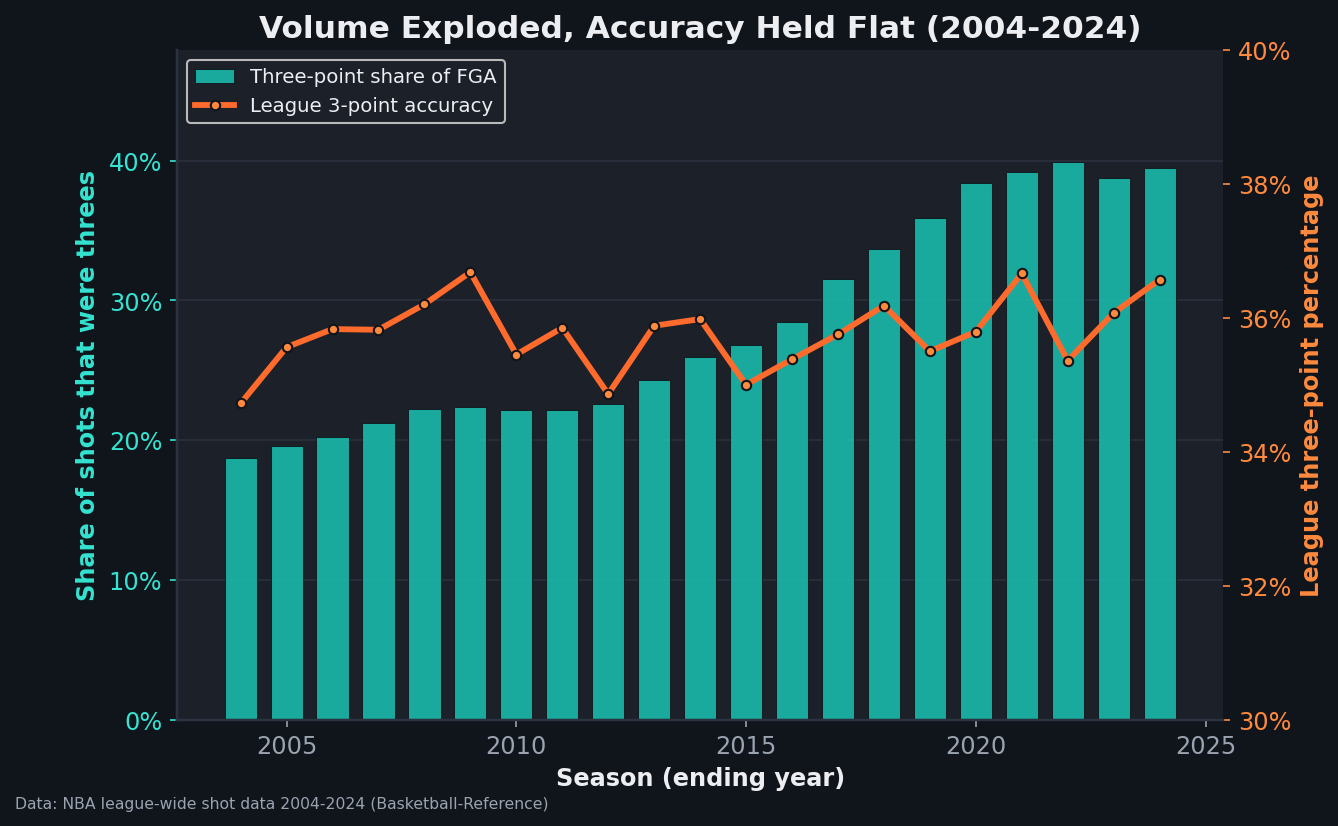
Plug in a league that shoots roughly 53% on twos and the threshold for a three to be the more valuable shot lands around 35%. The league has shot at or above that mark on threes in nearly every season of this window — it sat at 35.3% in 1999-00 and 35.9% in 2025-26, barely budging while volume nearly tripled. Read that again: accuracy held flat while attempts exploded. The shot didn't get better. Teams simply realized the shot had been underpriced for decades and started buying it in bulk. Once that inequality is on the whiteboard, the rest is just nerve.
Plotting the two series together makes the point impossible to miss. The bars are the share of shots that were threes; the line is the league's three-point accuracy. The bars nearly double; the line is basically flat:
The slow burn: the 2000s
For the first decade of this story, the chart barely tilts. Attempts crept from 13.7 in 1999-00 to 18.1 by 2008-09 — real growth, but glacial, the kind of drift you'd miss if you weren't measuring it. The shooters existed; the conviction didn't. Coaches still treated the three as a luxury or a comeback tool rather than a foundation, and a generation raised on post-ups and pull-up mid-range jumpers wasn't about to abandon them on the strength of a theory.
The era did seed the soil, though. The 2004 elimination of hand-checking stripped perimeter defenders of the right to ride ball-handlers with a forearm, which opened driving lanes and, by extension, the kick-out passes that feed open threes. Pace began its long climb off the rock-bottom, grind-it-out lows of the early 2000s. By 2008-09 the share had reached 22.4% — the room was filling with kindling. It just needed someone willing to strike a match and not flinch.
Morey's math and the Warriors' inflection
That someone, in spirit, was Daryl Morey. The Houston Rockets of the early-to-mid 2010s turned the break-even inequality above into an organizing religion: threes, layups, and free throws, with the mid-range treated as a tax to be avoided. The "Morey-ball" Rockets were mocked as soulless basketball-by-calculator, right up until everyone quietly copied them. League-wide attempts pushed from 18.4 in 2011-12 to 22.4 by 2014-15 as the math leaked out of Houston and into every front office that could read a per-possession table.
Then came the part the calculator couldn't have predicted: someone who made the optimal shot look like the easy shot. The 2014-15 and 2015-16 Golden State Warriors didn't merely take threes — Stephen Curry made them from distances and off actions that rewrote what counted as a "good" attempt, and the championships that followed turned a strategy into a mandate. You can see the hinge in the data. Attempts jumped from 22.4 in 2014-15 to 24.1 in 2015-16 to 27.0 in 2016-17 — the steepest three-year run in the entire series. The same conviction that reshaped offenses around the arc also reshaped who got to anchor a defense; I traced that knock-on effect in the evolution of the modern center, where the dying art of the back-to-the-basket big is the same story told from the other end of the floor.
| Season | 3PA / game | Share of all FGA |
|---|---|---|
| 1999-00 | 13.7 | 16.7% |
| 2004-05 | 15.8 | 19.6% |
| 2014-15 | 22.4 | 26.8% |
| 2018-19 | 32.0 | 35.9% |
| 2025-26 | 37.0 | 41.5% |
Normalization, and the ceiling question
What followed the Warriors was less an arms race than a stampede. Attempts ran from 27.0 in 2016-17 to 32.0 by 2018-19 to 34.1 in the bubble-shortened 2019-20 campaign, and the share crossed the symbolic one-third threshold and kept going. The edge Morey had monopolized became table stakes; when every team takes the efficient shot, the efficient shot stops being an advantage and starts being the baseline. This is what normalization looks like in a competitive market — alpha decays into convention.
The recent seasons hint that we may be brushing against a natural ceiling. Volume bounced around the mid-30s from 2020-21 through 2023-24, dipped to 34.2 in 2022-23, then pushed to a peak of 37.6 in 2024-25 before settling at 37.0 this past season. At better than 41% of all shots, the league may be approaching the point where the marginal three comes from a worse shooter or a worse look, and the break-even inequality starts cutting the other way. There are only so many open looks to go around, and defenses have spent a decade learning to run shooters off the line. The frontier of efficiency tends to wander into strange territory once everyone arrives at the obvious answer — a pattern I kept bumping into while cataloguing the most improbable seasons, where the outliers are usually the ones who found value the consensus had already priced out.
The takeaway
The three-point revolution is the cleanest example in modern sports of a market correcting a long-standing mispricing. The shot was always worth 50% more; for decades, teams acted as if it were worth roughly the same as a long two and rationed it accordingly. When the analytics finally caught the discrepancy and a transcendent shooter made the math look like art, the entire league repriced its offense in under a decade — 13.7 attempts became 37.0, and one shot in six became two in five. The line never moved. We just finally learned to read the receipt.
Sources & Further Reading
- For the fundamentals, see Chapter 7: Rate Statistics and Pace Adjustment in DataField.dev’s free textbook library.
- League-wide three-point data by season: NBA.com/stats, pulled via the nba_api Python package (1999-00 through 2025-26, retrieved June 2026). The aggregation script is in
scripts/pace_and_space.py. - Historical context, rule-change dates, and pace figures: Basketball-Reference.
- The break-even framework — threes, layups, and free throws over mid-range — is most associated with Daryl Morey's Houston Rockets, but the underlying arithmetic is as old as the three-point line itself.