Drop a prime 2013-14 center into a game tonight and he would look like a man who wandered onto the wrong court. Back to the basket, planted on the block, waiting for an entry pass that the offense no longer throws — it would read less like a throwback and more like a misprint. I pulled every qualified center's shooting line from 2013-14 through 2025-26 to watch the position rewrite itself, and the numbers are blunt about it. The average center's three-point attempts went up fivefold, and the back-to-the-basket post-up quietly died on the way.
The fingerprint, in one number
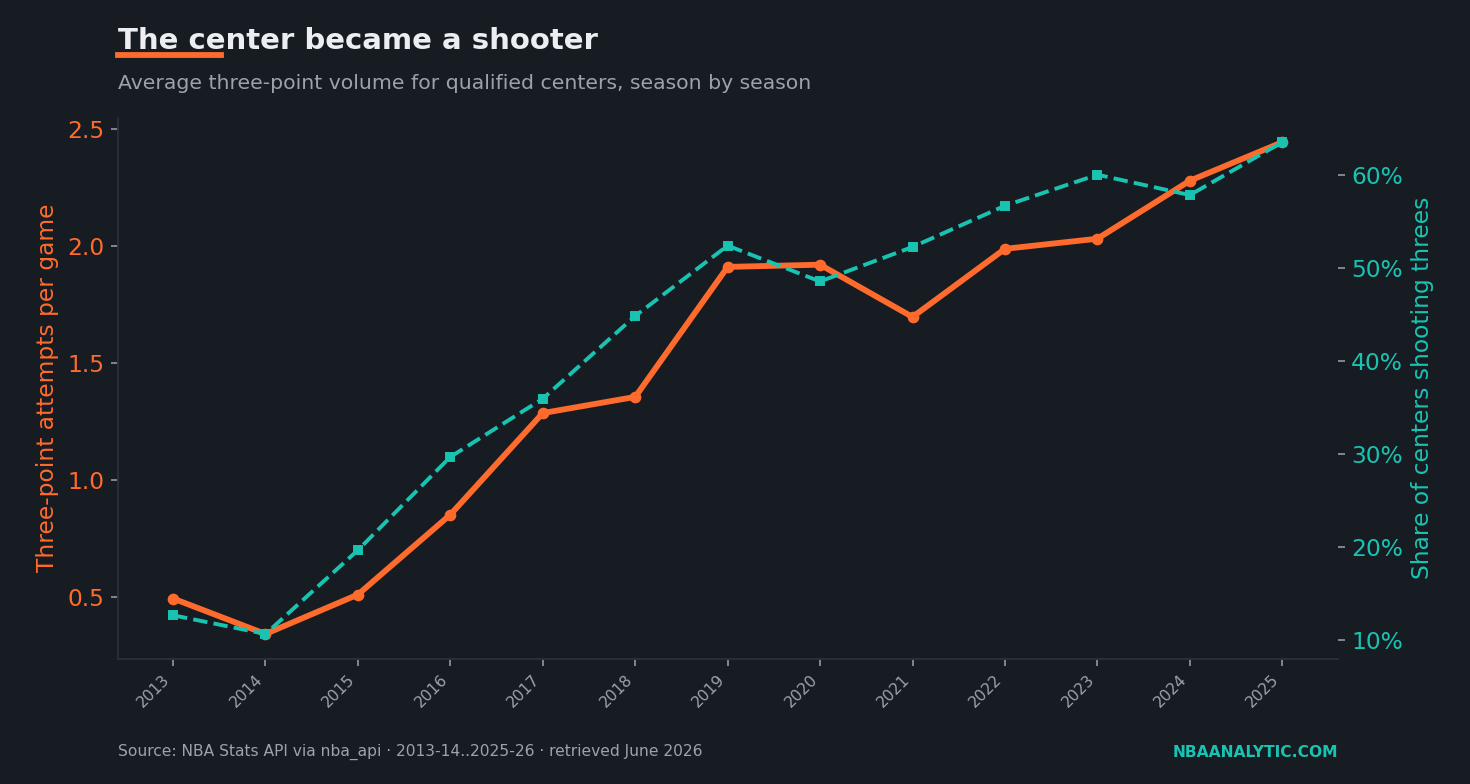
Start with the headline. In 2013-14, the average qualified center attempted 0.49 threes per game — call it one every other night, usually an end-of-quarter accident. By 2025-26 that figure was 2.44, a clean 5.0× increase. Nothing else about the box score moved that violently in a decade. The center didn't add a wrinkle to his game; he swapped the foundation underneath it.
The participation number is even starker, because an average can hide behind a few outlier gunners. So I counted the share of centers taking at least one three a game — a low bar, just "is this a thing you do at all." In 2013-14 it was 12.7%, roughly one big man in eight. By 2025-26 it was 63.5%. The stretch five went from a novelty act to the default setting in ten seasons.
The death of the post-up
What got traded away to make room was the lowest-efficiency staple in the sport: the back-to-the-basket post-up. For a stretch of NBA history the center's job description was to receive the ball on the block, dribble twice, and turn a defender into a problem from twelve feet. The math eventually caught up. A contested fadeaway two is one of the worst shots a possession can produce, and once front offices internalized the three-point revolution, the entry pass stopped coming. The post-up didn't get coached out of the game so much as priced out of it.
You can see the changeover in the early years of the series. The three-point rate barely budged from 2013-14 to 2015-16 — it actually dipped to 0.34 in 2014-15 before recovering — and then the dam broke. By 2016-17 the average center was up to 0.85 attempts with the shooting share at 29.7%, and by 2019-20 the share crossed half the league at 52.4%. That two-season jump in the back half of the 2010s is the post-up's obituary, written in attempt rates.
The stretch five and the pick-and-pop
The replacement for the post-up wasn't a different shot for the center so much as a different gravity. A big man who can hit from twenty-three feet drags his defender out of the paint, and that vacated space is worth more to the offense than the threes themselves. This is the engine of the pick-and-pop: the center sets a screen, the defense has to choose, and a beat later he's catching at the arc with a runway in front of him. The threat is the point. The make is a bonus.
That's why the participation share matters more to me than the raw attempt count. Going from 12.7% to 63.5% of centers being credible from distance means defenses can no longer park a slow-footed rim protector in the lane and ignore him. The floor got wider one big man at a time, and crucially, the league did it without sacrificing accuracy — centers connected at 33.1% from three in 2013-14 and 35.3% in 2025-26, so the extra two attempts a night aren't bricks, they're points.
The center as a passing hub
The shooting story gets most of the headlines, but the quieter shift might be the more important one: the modern center passes. Spacing the floor pulls a big man away from the rim, and the natural place to put him is at the top of the key — the one spot on the court with eyes on every cutter. So the position's assist rate climbed too. The average center handed out 1.36 assists per game in 2013-14; by 2025-26 that was 2.22, with the trend turning up hard in the 2023-24 season at 2.25. The offense stopped running to the center and started running through him.
It's a smaller multiple than the shooting numbers, and it should be — handoffs and high-post reads were never as rare as the corner three. But it reframes the job. The prototype is no longer a finisher who occupies the dunker spot; it's a connector who can shoot you out of a double team and find the cutter when you don't send one. The post-up center was an endpoint. The modern center is a junction.
The decade at milestone seasons
Numbers in a paragraph blur together, so here is the same evolution at four checkpoints, each pulled straight from the season-by-season series:
| Season | 3PA/G | AST/G | % Shooting 3s |
|---|---|---|---|
| 2013-14 | 0.49 | 1.36 | 12.7 |
| 2016-17 | 0.85 | 1.51 | 29.7 |
| 2019-20 | 1.91 | 1.86 | 52.4 |
| 2022-23 | 1.99 | 1.98 | 56.7 |
| 2025-26 | 2.44 | 2.22 | 63.5 |
Read the columns top to bottom and the slope tells the story better than I can. Every number moves the same direction, and the steepest climb in all three lands between 2016-17 and 2019-20 — the seasons the stretch five stopped being a curiosity. After that the trend flattens but never reverses, which is its own kind of evidence: this wasn't a fad that crested, it was a position settling into a new shape.
The takeaway
The center who anchored a 2013-14 offense wasn't bad at his job — he was excellent at a job the league deleted. In one decade the position's three-point volume quintupled, the share of centers who shoot from range went from one-in-eight to two-in-three, and the assist rate crept up alongside it as the big man drifted from the block to the top of the key. That's not a player getting better. That's a role being rebuilt around what the math always rewarded: spacing, passing, and shots worth more than two points. The post-up center is a museum piece now, and the numbers stopped pretending otherwise years ago.
Sources & Further Reading
- Center shooting and playmaking data: NBA.com/stats, pulled via the nba_api Python package (2013-14 through 2025-26, retrieved June 2026). The collection and aggregation script is in
scripts/modern_center_evolution.py. - Stat definitions and positional context: Basketball-Reference Glossary.