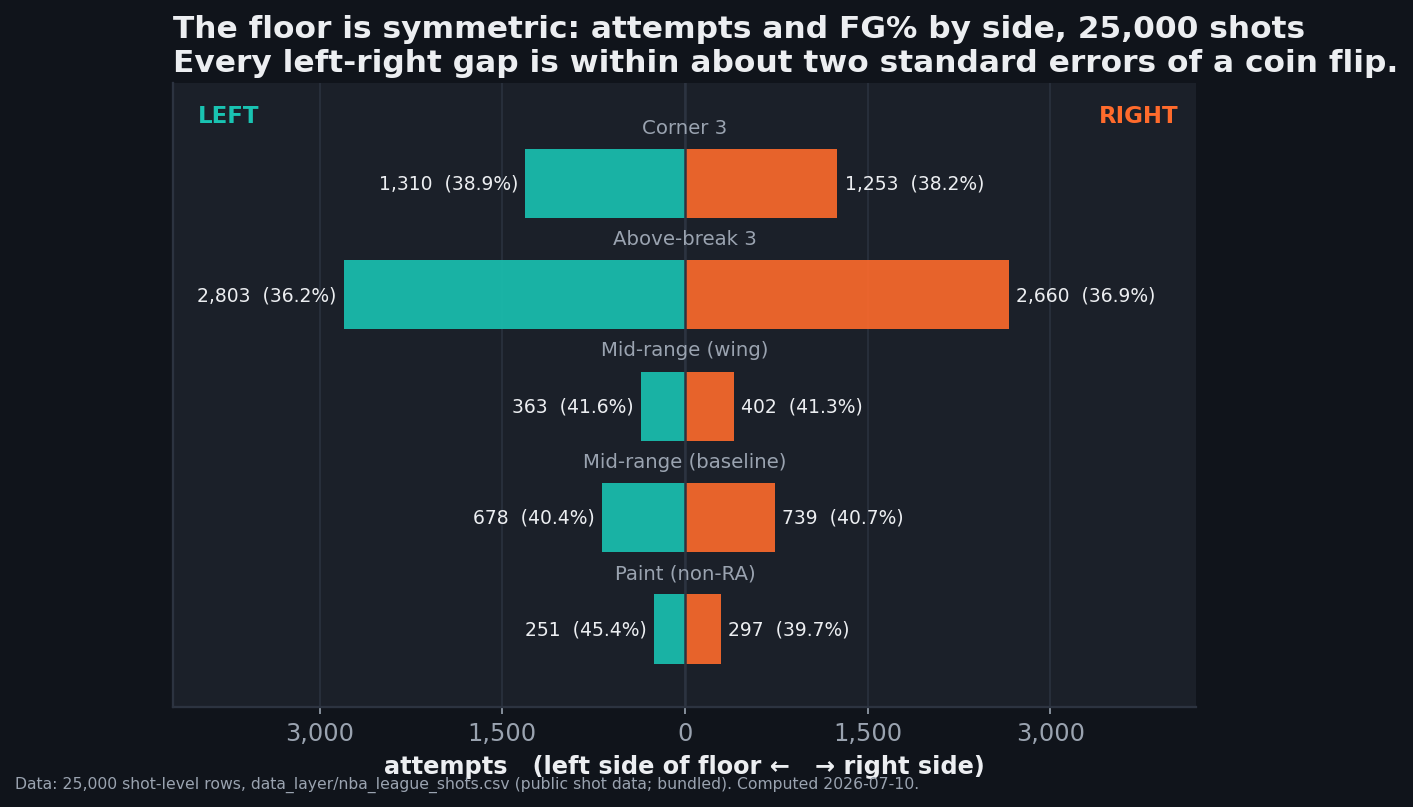
Basketball folklore says the floor has a grain. Shooters are supposed to love "their" corner, right-handed drivers supposedly bend every offense rightward, and any scout will tell you certain spots just feel different. We took the 25,000 shot-level records bundled in the data layer — every one tagged with its zone and side of the floor — and went looking for the NBA's left-right bias. The result is the cleanest null we've published: the two sides of an NBA floor are statistically indistinguishable, right down to an identical 38.2% field-goal percentage on each side.
The test
Every shot in the file carries a ZONE_NAME that includes its side — Left Corner 3, Right Side Center, and so on. That gives five natural left-right zone pairs: the corners, the above-break wings, two mid-range bands, and the non-restricted paint. For each pair we counted attempts and made shots per side, then asked the only two questions that matter: do players shoot more from one side, and do they make more from one side?
Of the 25,000 shots, 14,244 come from center zones (the restricted area and straight-on attempts) and don't have a side. The remaining 10,756 sided attempts split 5,405 left, 5,351 right — 50.3% to 49.7%. Against a coin flip, that's a gap of a quarter of a percentage point, one half of one standard error. The volume verdict arrives before the decimal does: there is no meaningful side preference in where NBA shots come from.
The corners: no, there is no "shooter's corner"
The corner three is where the folklore is loudest, so it deserves its own paragraph. Left corner: 1,310 attempts, 38.9%. Right corner: 1,253 attempts, 38.2%. The volume tilt toward the left corner is 51.1% of corner attempts — 1.1 standard errors from a coin flip. The accuracy gap is 0.7 percentage points with a standard error of 1.9 — 0.4 standard errors, which is to say: nothing. Both corners comfortably out-shoot the above-break zones (36.2–36.9%), confirming the corner-three edge we've covered before — but the edge belongs to both corners equally. If your favorite player insists the left corner is his spot, that's psychology, and psychology is real — it just doesn't show up in the league-wide make rates.
The one borderline signal, and why we don't trust it
The closest thing to an asymmetry in the file is above-break volume: 2,803 attempts from the left wing against 2,660 from the right — 51.3% left, about 1.9 standard errors from even. That's the kind of number that gets a headline if you want one and a shrug if you're honest. One borderline reading among five zone pairs and two metrics apiece is exactly the multiple-comparisons situation where something is supposed to wander near the significance line by accident. We also can't rule out a real, boring cause — right-handed ball-handlers driving right and kicking to the weak-side wing would tilt attempts left — but the zone data carries no handedness, so that's a hypothesis for a dataset we don't have, not a finding from the one we do.
The paint pair illustrates the sample-size trap from the other direction: left-side non-restricted paint shots dropped at 45.4% against 39.7% on the right — a 5.7-point gap that looks enormous until you notice it rests on 251 and 297 attempts, which puts it at about 1.3 standard errors. Floaters and push shots are the rarest sided attempts in the file; their splits are the least trustworthy numbers on the chart.
Why symmetry is the sane result
Step back and the null makes sense. A shot chart aggregates hundreds of players — lefties and righties, corner specialists planted on either wing, offenses that run sets to both sides by design. Individual players absolutely have sided tendencies; aggregate them across a league that scouts and counters every tendency, and the tilts cancel. The floor itself offers no reason for bias: the rims are round on both sides. What survives aggregation isn't direction, it's geometry — the corner-versus-wing gap (shorter line, better percentage) shows up on both sides identically, and the restricted area's 65.8% towers over everything regardless of approach side. Distance and shot type move make rates by tens of points; side moves them by tenths.
That's the practical takeaway for reading any shot chart: when a single player's chart glows on one side, that's information about the player. When someone claims the league leans a direction, ask for the standard error. Across 25,000 shots, the NBA is ambidextrous.
Sources & method
- Shot-level data: 25,000 records with zone, side, and outcome, bundled at
data_layer/nba_league_shots.csv(public shot data; sourcing notes indata_layer/SOURCE.txt). All splits computed 2026-07-10; the chart ischart_left_right_symmetry.py. - Standard errors: binomial — √(0.25/n) for attempt shares against an even split, √(p₁q₁/n₁ + p₂q₂/n₂) for FG% differences.
- Related on this site: the corner three, explained · where the NBA actually shoots from · accuracy vs distance.