Everyone wants the one number. Point at a player, read a single value, declare him the 7th-best in the league, and move on. All-in-one metrics — BPM, PER, PIE, RAPM, EPM, LEBRON — exist to scratch exactly that itch, and they're genuinely useful. But a single number is a compression of forty-eight minutes of basketball down to one decimal, and compression always throws something away. The trick is knowing what got thrown away before you quote the number at someone.
Three families, three philosophies
Every all-in-one metric is trying to answer the same question — how much is this player worth per possession, in points, relative to a league-average baseline — but they disagree on what evidence to trust. They sort into three families, and once you know which family a metric belongs to, you already know its blind spots.
The three families of all-in-one metricsBox-score-based (BPM, PER, PIE) — built only from the counting stats in the box score. Plus-minus-based (RAPM) — built only from what happens to the scoreboard when a player is on the floor. Hybrids (EPM, LEBRON) — a blend that uses box-score data to stabilize a plus-minus signal.
Box-score metrics like Box Plus/Minus, John Hollinger's PER, and NBA.com's PIE are fast, transparent, and available for every player in history, because the box score is. Pure plus-minus models like Regularized Adjusted Plus/Minus throw out the box score entirely and ask a blunter question: when this man checks in, does the margin move in his team's favor, after adjusting for the nine other players on the court? Hybrids like dunksandthrees' EPM and LEBRON try to get the best of both — the stability of box-score inputs with the on/off truth of plus-minus.
One footnote that trips people up: VORP is not a separate philosophy. It's just BPM converted into wins above replacement over a player's actual playing time — the per-100 rate scaled by how many minutes he logged. A high-BPM player on a minutes limit will trail a slightly-lower-BPM player who never leaves the floor. That's a feature, not a bug, and it's why both columns live in the table below.
What each family can and can't see
Box-score metrics have a structural ceiling: they can only measure what the scorekeeper writes down. A guard who blows up a play by stunting at the right moment, a wing who erases a cutter before the pass is even thrown, a center whose mere presence reroutes the entire offense away from the rim — none of that becomes a stat. Steals and blocks are the rare gambling-style defensive plays that do get recorded, so box metrics systematically reward the chaos-makers and undervalue the disciplined, positionally-sound defenders who never need to gamble. Off-ball defense is the genre's permanent blind spot.
Plus-minus metrics see all of that, because they don't care how the scoreboard moved, only that it did while you were out there. The catch is sample size. Five players share every possession, and untangling one man's contribution from his four teammates and five opponents requires an enormous amount of data before the estimate stops bouncing around. Early in a season, a pure RAPM figure is mostly noise. Hybrids exist precisely to paper over that gap — the box-score component gives the model something to lean on while the plus-minus signal slowly accumulates.
What the leaderboard shows
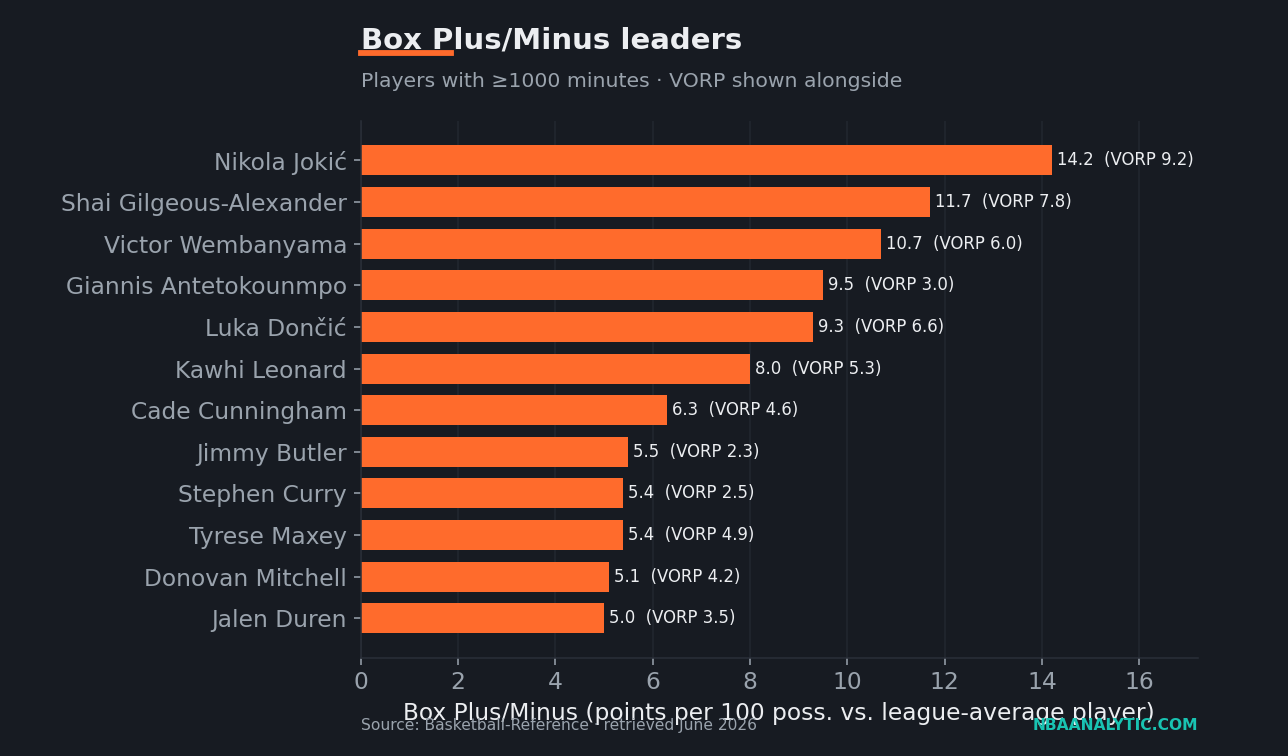
Here's the top of the BPM board this season, paired with each player's VORP so you can see the minutes effect in action.
| Player | BPM | VORP |
|---|---|---|
| Nikola Jokić | 14.2 | 9.2 |
| Shai Gilgeous-Alexander | 11.7 | 7.8 |
| Victor Wembanyama | 10.7 | 6.0 |
| Giannis Antetokounmpo | 9.5 | 3.0 |
| Luka Dončić | 9.3 | 6.6 |
| Kawhi Leonard | 8.0 | 5.3 |
| Cade Cunningham | 6.3 | 4.6 |
| Jimmy Butler | 5.5 | 2.3 |
| Stephen Curry | 5.4 | 2.5 |
| Tyrese Maxey | 5.4 | 4.9 |
| Donovan Mitchell | 5.1 | 4.2 |
| Jalen Duren | 5.0 | 3.5 |
Watch the BPM/VORP relationship rather than the raw ranking. Giannis sits fourth in BPM at 9.5 but his VORP of 3.0 falls behind Kawhi, Cade, Maxey, and Mitchell — all of whom carry lower per-possession marks but log the minutes to bank more total value. Jokić, meanwhile, leads both columns by a comfortable margin, which is the boring kind of consensus these metrics produce when a season has an obvious best player.
Why they mostly agree — and where they don't
If these metrics measured wildly different things, they'd be useless. They don't. Comparing this season's BPM against NBA.com's PIE — a box-score metric from a different shop, built with a different formula — across the 165 players who qualify in both, the Spearman rank correlation comes out to 0.834. That's high. At the top of the league, the families nod along: the best players are obvious enough that no reasonable formula misses them, and that broad agreement is your license to use an all-in-one as a quick first read.
The interesting part is the residue — the players where the metrics actively argue. These are the disagreements worth your attention, because the gap is usually telling you something specific about the game.
| Player | BPM | PIE |
|---|---|---|
| Ausar Thompson | 3.1 | .101 |
| Cason Wallace | 1.2 | .076 |
| Ivica Zubac | -0.3 | .130 |
| Deandre Ayton | -0.9 | .117 |
| Maxime Raynaud | -2.4 | .109 |
Look at the shape of it. Ausar Thompson and Cason Wallace are perimeter defenders whose BPM (3.1 and 1.2) outruns what their PIE (.101 and .076) is willing to credit — the disruptive, deflection-heavy defense that BPM partially rewards through steals and blocks, while PIE leans more on raw scoring and rebounding. Then it flips: Ivica Zubac, Deandre Ayton, and Maxime Raynaud are bigs whose PIE (.130, .117, .109) loves them for boards and clean finishes, while BPM has all three at or below replacement level (-0.3, -0.9, -2.4). Two formulas, same box score, opposite verdicts — and the fault line runs straight through defense and position, exactly where box metrics are weakest. This is the same lossiness that makes projection systems disagree about the same player.
How to actually use them
Treat an all-in-one as the opening line of an argument, not the closing one. It is excellent for the rough cut — sorting two hundred players into a sane order in one column, flagging who deserves a closer look. It is bad at being the final word, because the closer two players sit, the more the gap between them lives inside the exact stuff the metric had to compress away: shot difficulty, role, defensive scheme, who they were guarding.
My workflow is unglamorous. Start with the all-in-one to set the rough order. When two players are close, or when the box-score metric and the plus-minus metric disagree about someone, stop trusting the number and go open the components — including the Four Factors and the film. The single number got you to the right neighborhood. It was never going to tell you which house. Anyone who quotes one all-in-one to three decimal places and rests the case has mistaken a starting point for a verdict.
Sources & Further Reading
- Free textbook: Chapter 12: Box Plus-Minus (BPM) and VORP — the theory behind this, at DataField.dev.
- BPM, VORP, and stat definitions: Basketball-Reference. PIE and on/off data: NBA.com/stats.
- Hybrid plus-minus metrics: EPM is published by dunksandthrees; LEBRON by BBall Index. RAPM is the public-domain plus-minus method both build on.
- BPM leaders, the BPM-vs-PIE rank correlation, and the disagreement list were generated by
scripts/bpm_epm_all_in_one.py(2025-26, retrieved June 2026).