A power ranking is just a sorted list with opinions attached. You can pay a website to generate one, or you can build a defensible version yourself in about ten minutes with a single column of numbers and zero code. The number that does the heavy lifting is net rating — points scored minus points allowed per 100 possessions — and a spreadsheet is all the infrastructure you need to turn 30 of them into a ranking you can actually justify.
Why net rating is the right backbone
Wins and losses are the obvious place to start, and they're a trap. A 50-win team that won fifteen games by two points is not the same as a 50-win team that won fifteen by twenty, but the standings flatten them into the same row. Net rating doesn't. It asks the only question that survives contact with the playoffs: when this team is on the floor, does the scoreboard move in their favor, and by how much? Because it's expressed per 100 possessions, it also strips out pace, so a fast team and a slow team are measured on the same scale. If you want the longer argument for why offensive and defensive rating beat raw point differential, I made it in this breakdown of the two ratings. For our purposes, the short version is enough: net rating is the best single-number team-strength stat that a normal person can pull for free.
Build the ranking: six steps, no code
Here is the entire workflow. Steps one through four get you a legitimate ranking; five and six are where you turn it from a sorted table into something with judgment behind it.
- Get the team Advanced ratings. You need each team's Offensive Rating, Defensive Rating, and Net Rating. The clean way is to pull them programmatically — I walk through exactly that in getting started with the NBA API, which hands you a table you can export straight to CSV. The no-code way: open NBA.com/stats, go to the team Advanced stats page, and the same three columns are sitting right there to copy.
- Paste Off, Def, and Net into a sheet. One row per team, columns for team name, ORtg, DRtg, and NetRtg. Add a wins and losses column while you're at it; you'll want it for the sanity check at the end. Thirty rows, done.
- Sort by Net Rating, descending. Select the data, sort on the NetRtg column, largest first. That single click is your power ranking. Everything after this is polish.
- Add a rank column. Number the sorted rows 1 through 30. If you'd rather have the sheet do it so it survives a re-sort,
=RANK(D2, D$2:D$31)on the NetRtg column returns each team's rank automatically. - Optionally blend in recent form. Full-season net rating is stable but slow to react to a trade or an injury. If you want the ranking to feel current, pull each team's net rating over its last 10 games (the same Advanced page offers a "Last 10" filter) and take a weighted average that leans on the season number but lets recent play nudge it:
Power score — blend season with recent formPower = 0.7 × NetRtg(season) + 0.3 × NetRtg(last 10)
In the sheet that's just =0.7*D2 + 0.3*E2 dragged down the column, then re-sort on the Power column instead of raw NetRtg. The 70/30 split is a choice, not a law — crank the recent-form weight up if you trust momentum, down if you think ten games is noise. There is no correct answer, which is exactly why writing the weight down beats pretending you don't have one.
- Eyeball the sanity checks. Sort done, now squint. Does the ranking roughly track the standings? Where it doesn't, that's the interesting part, not an error — a team ranked higher than its record usually means bad luck in close games, and a team ranked lower means the opposite. If a 60-win team shows up at #9, double-check you didn't fat-finger a defensive rating.
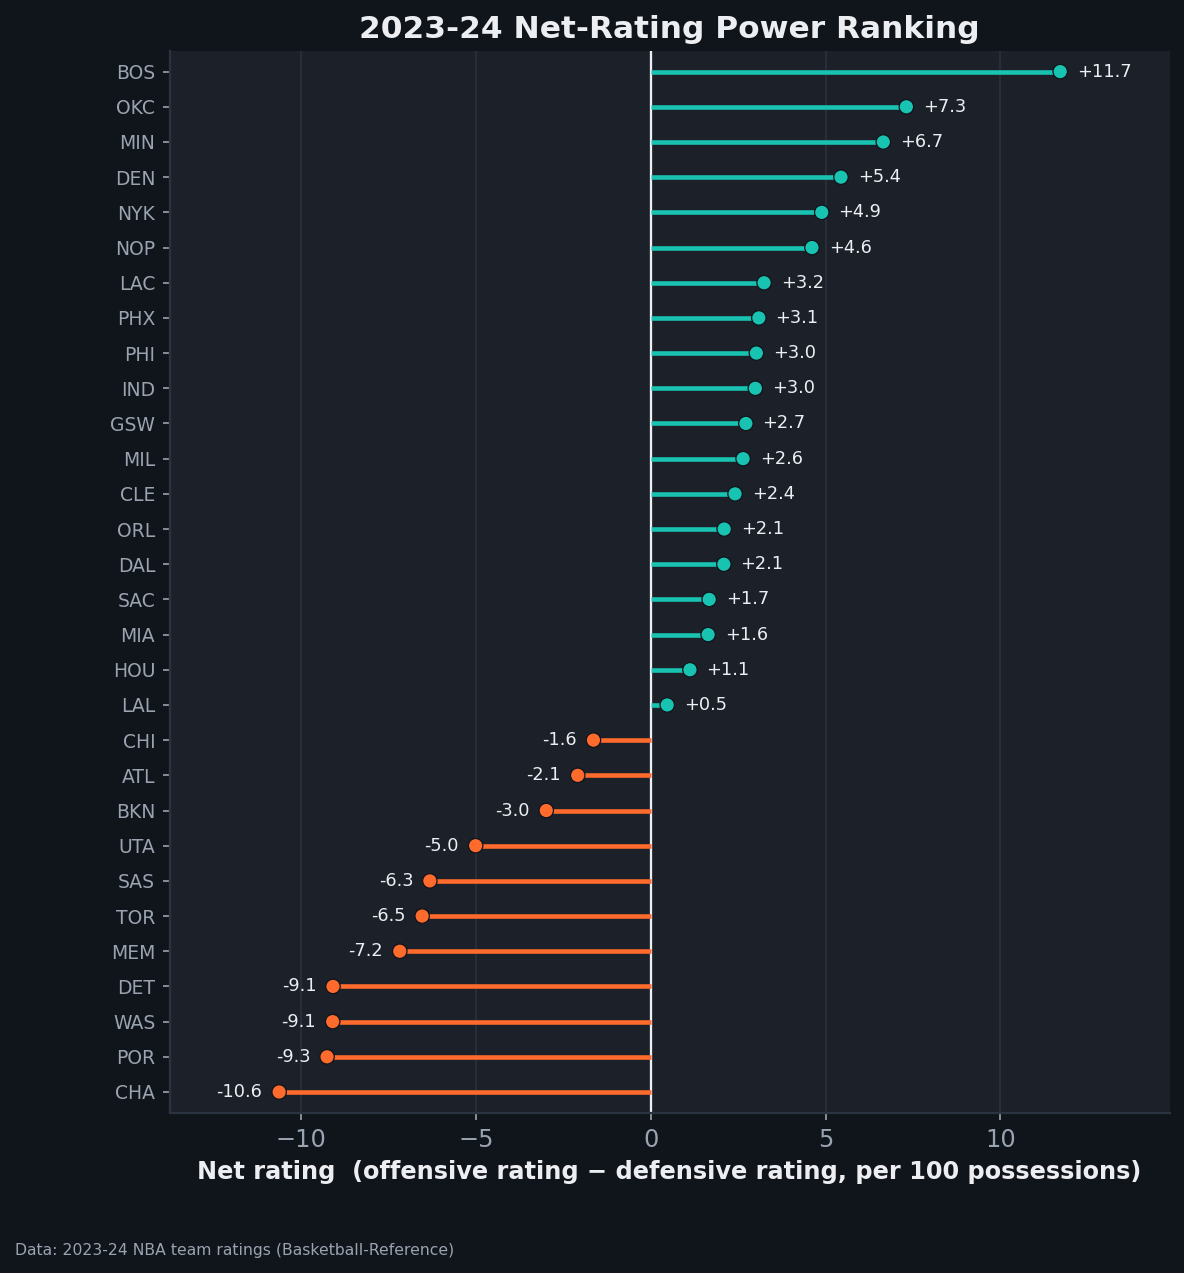
If you want to see the finished shape this method produces on a completed season — the same sorted-by-net-rating ladder, drawn as a lollipop so the gaps are obvious — here is 2023-24:
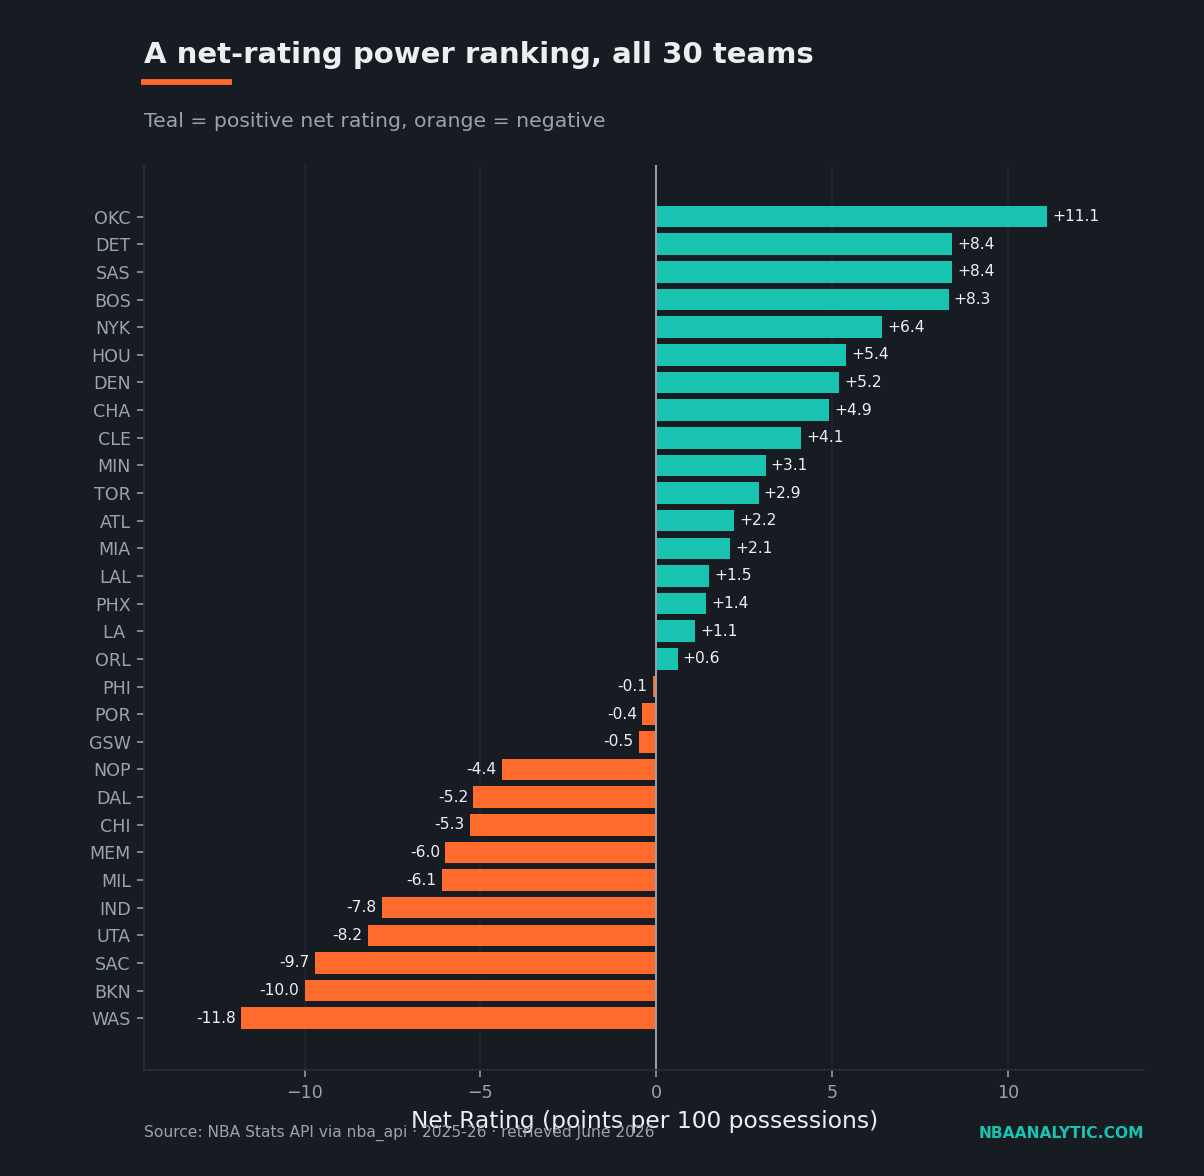
What the 2025-26 ladder looks like
Run the recipe on this season and the top of the table is genuinely separated. Oklahoma City sits at +11.1, which is not just first but first by a comfortable margin — the next-closest team, Detroit, is at +8.4. Below that, the ranking immediately starts doing work the standings can't. Look at rows two and three: Detroit and San Antonio are tied at +8.4 net rating, yet the Spurs won 62 games to the Pistons' 60. That's the close-game luck I mentioned, made visible. And notice Charlotte at #8 with a 44-38 record, sitting ahead of a 52-win Cleveland team — the kind of result that looks like a typo until you remember net rating is grading process, not outcomes.
| Rank | Team | ORtg | DRtg | NetRtg | W-L |
|---|---|---|---|---|---|
| 1 | Oklahoma City Thunder | 117.6 | 106.5 | +11.1 | 64-18 |
| 2 | Detroit Pistons | 117.3 | 108.9 | +8.4 | 60-22 |
| 3 | San Antonio Spurs | 118.7 | 110.4 | +8.4 | 62-20 |
| 4 | Boston Celtics | 120.0 | 111.7 | +8.3 | 56-26 |
| 5 | New York Knicks | 118.7 | 112.3 | +6.4 | 53-29 |
| 6 | Houston Rockets | 117.5 | 112.1 | +5.4 | 52-30 |
| 7 | Denver Nuggets | 121.2 | 116.0 | +5.2 | 54-28 |
| 8 | Charlotte Hornets | 118.4 | 113.5 | +4.9 | 44-38 |
| 9 | Cleveland Cavaliers | 118.3 | 114.1 | +4.1 | 52-30 |
| 10 | Minnesota Timberwolves | 115.6 | 112.5 | +3.1 | 49-33 |
The other thing worth reading off this table is how teams arrive at the same place. Denver is #7 on a 121.2 offense that's the best in the top ten, dragged down by a 116.0 defense that's the worst of the group — they outscore the problem. Houston, one spot ahead, gets there the opposite way, with a middling offense and a defense two and a half points stingier. Same neighborhood, opposite blueprints, and the net rating column is the only one that treats both routes as equally valid, because on the scoreboard they are.
Where this ranking stops being trustworthy
I'd rather you use this than a vibes-based top ten, but be honest about its blind spots, because they're real. Net rating does not adjust for strength of schedule. A team that feasted on the bottom of the table and a team that survived a brutal slate can post the same number, and raw net rating can't tell them apart — it assumes every opponent was league-average, which is never true. It's also blind to health: a +8 net rating built by a roster that's since lost its best player to injury is describing a team that no longer exists. And it doesn't know what month it is, so an early-season figure off twelve games carries the same weight in the formula as a settled 70-game sample, even though one is mostly noise. The last-10 blend in step five patches the staleness a little; it does nothing for schedule or injuries. For those you either reach for an adjusted system or you do the adjusting in your head — which is fine, as long as you know that's what the eyeball step is actually for.
The takeaway
A power ranking doesn't have to be a black box or a hot take. It can be one honest column of numbers, sorted, with the assumptions written down where you can argue about them. Net rating gives you the column; the spreadsheet gives you the sort; the 70/30 weight and the sanity check are where your judgment goes on the record. That's a ranking you can defend in a group chat, which is more than most published ones can say. Start with the sorted table, and only override it when you can name the reason — schedule, health, or sample size. Those three are almost always the story.
Sources & Further Reading
- Theory: Chapter 17: Team Offensive Efficiency — a free chapter at DataField.dev.
- Team Advanced ratings (Offensive, Defensive, Net): NBA.com/stats, pulled via the nba_api Python package (2025-26, retrieved June 2026). The ranking script is in
scripts/net_rating_power_ranking.py. - Stat definitions and possession-based rating background: Basketball-Reference Glossary.