Every chart on this site starts the same dull, glorious way: a Python script asks stats.nba.com a question and writes the answer to disk. The package that does the asking is nba_api, and it is the single fastest way to go from "I have an opinion about the scoring race" to "I have the actual numbers." This is the tutorial I wish I'd had — install it, make one real call, understand what comes back, and learn the etiquette that keeps the API from quietly blocking you.
Install it (one line)
There is no account, no API key, no signup email that takes three business days. The NBA's stats site exposes a sprawling, undocumented JSON API, and nba_api is a community package that wraps the useful corners of it in tidy Python classes. You install it the way you install anything:
pip install nba_apiThat pulls in pandas and requests as dependencies, which are the only other pieces you need for this whole tutorial. If you work in virtual environments — and you should — activate yours first so this doesn't land in your system Python. That's the entire setup. We can go ask the league a question now.
Your first call
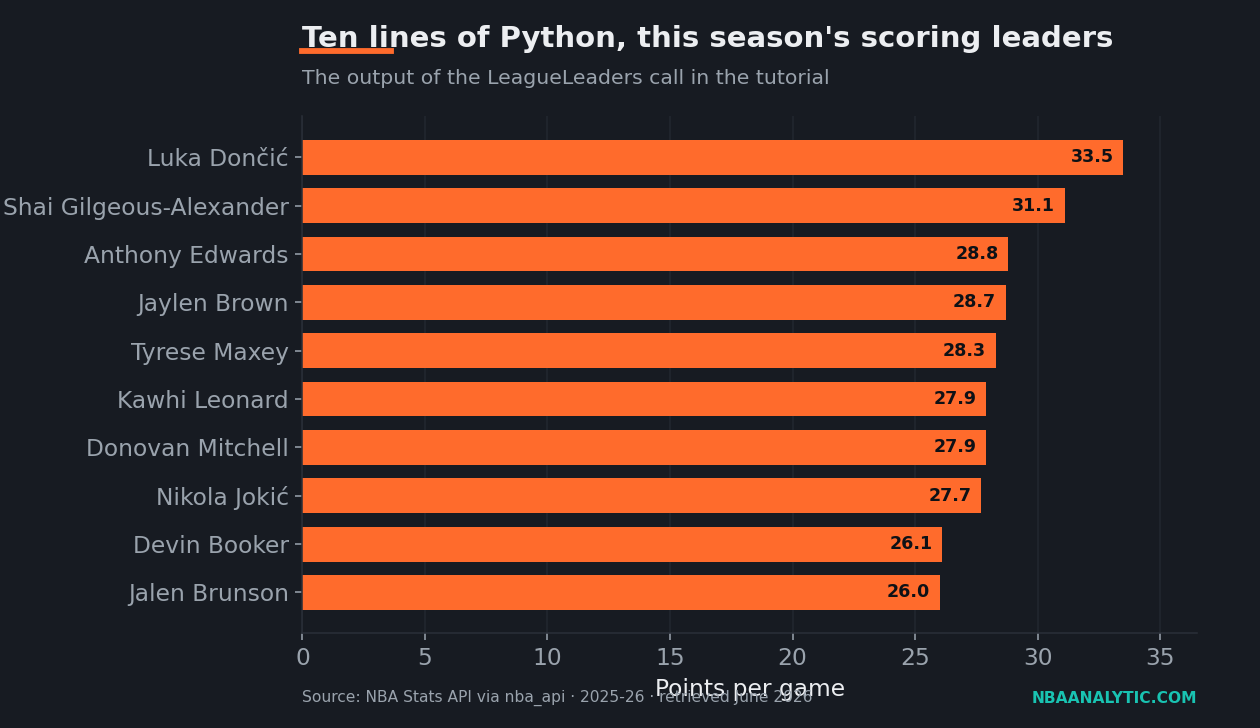
Here's the question: who are this season's per-game scoring leaders? The endpoint that answers it is LeagueLeaders. You hand it a season, a season type, a stat category, and a "per mode," and it hands back a table. This snippet is the real thing — it's a faithful, paste-ready version of the script that generated the chart below:
from nba_api.stats.endpoints import leagueleaders

# Ask stats.nba.com for this season's per-game scoring leaders.
leaders = leagueleaders.LeagueLeaders(
    season="2025-26",
    season_type_all_star="Regular Season",
    stat_category_abbreviation="PTS",
    per_mode48="PerGame",
    timeout=30,
)

# Endpoints can return several tables; the leaderboard is the first one.
df = leaders.get_data_frames()[0]

# Sort by points and look at the top of the race.
top = df.sort_values("PTS", ascending=False).head(10)
print(top[["RANK", "PLAYER", "TEAM", "GP", "PTS"]])
Run that and the top line that prints is Luka Dončić, now in a Lakers uniform, at 33.5 points per game across 64 games. Shai Gilgeous-Alexander is right behind at 31.1, and Anthony Edwards rounds out the podium at 28.8. Ten lines of Python, the live scoring race. The per_mode48 argument name is a piece of NBA-API archaeology — it dates back to a 48-minute-pace option — but "PerGame" is what you want, and the awkward keyword is a good early lesson: this API was built for the NBA's own website, not for you, and the parameter names show it.
What a DataFrame is
Notice that the call ends in .get_data_frames()[0], and that what we sorted was a thing called df. That object is a pandas DataFrame, and if you're new to data work in Python it's the one concept worth slowing down for. A DataFrame is a spreadsheet that lives in memory: labeled columns (PLAYER, TEAM, PTS, GP) and one row per record — here, one row per player. Everything you'd do in Excel, you do with a method call instead.
The reason this matters is that almost every nba_api endpoint returns a DataFrame, so the handful of moves you learn here transfer everywhere. A few you'll use constantly:
# Pick columns:
df[["PLAYER", "PTS"]]

# Filter rows — only players averaging 25+:
df[df["PTS"] >= 25]

# Sort, then take the top of the list:
df.sort_values("PTS", ascending=False).head(10)

# Compute a new column from existing ones (total points scored):
df["TOTAL_PTS"] = df["PTS"] * df["GP"]
An endpoint can return more than one table, which is why get_data_frames() gives you a list and we index [0]. For LeagueLeaders the first table is the leaderboard and that's all there is; for richer endpoints, index 1, 2, and 3 might hold splits, summaries, or supporting rows. When in doubt, print len(leaders.get_data_frames()) and inspect each one.
Picking the right endpoint
The hard part of nba_api isn't writing the call — it's knowing which of the dozens of endpoints answers your question. The mental model that helps me: ask whether you want a leaderboard, a full-league table, or one entity's detail.
- One ranked stat, league-wide?
LeagueLeaders— exactly what we used. Great for "top scorers / rebounders / assisters." - Every player, many stats at once?
LeagueDashPlayerStats, with ameasure_typeofBase,Advanced,Usage, orScoring. This is the workhorse behind most of the efficiency pieces here. - Every team?
LeagueDashTeamStats— same idea, team level. It's where the Four Factors numbers come from. - One game's box score, or one player's shot locations?
BoxScoreTraditionalV2andShotChartDetail— the latter is the backbone of the shot-chart tutorial.
Every one of these returns DataFrames, so the skills from the last section carry straight over; you're really only learning new parameter names. The package's GitHub README lists all of them, and if you'd rather not learn the NBA's API at all, my roundup of free basketball data sources covers the friendlier alternatives.
The numbers it returns
To make the leaderboard concrete, here is the exact top ten the call above produces, copied straight from the DataFrame. This is also a tidy demonstration of what "one row per player, labeled columns" looks like once it's on a page:
| Rank | Player | Team | PPG |
|---|---|---|---|
| 1 | Luka Dončić | LAL | 33.5 |
| 2 | Shai Gilgeous-Alexander | OKC | 31.1 |
| 3 | Anthony Edwards | MIN | 28.8 |
| 4 | Jaylen Brown | BOS | 28.7 |
| 5 | Tyrese Maxey | PHI | 28.3 |
| 6 | Kawhi Leonard | LAC | 27.9 |
| 7 | Donovan Mitchell | CLE | 27.9 |
| 8 | Nikola Jokić | DEN | 27.7 |
| 9 | Devin Booker | PHX | 26.1 |
| 10 | Jalen Brunson | NYK | 26.0 |
Mitchell and Leonard are tied at 27.9 to the tenth of a point, which is the kind of thing you only notice when you have the table instead of a vibe. That's the entire pitch for learning this: opinions about the scoring race are cheap, and the data is now ten lines away.
Rate-limit etiquette (read this part)
Here is where most first-time nba_api users get themselves in trouble. The stats endpoints are not a public, supported API — they're the NBA's own website plumbing, and they will time out, hang, or temporarily stop answering you if you're rude. Three habits keep you on the polite side, and they're baked into every script on this site:
1. Send real headers and a generous timeout. Out of the box, requests to stats.nba.com often hang forever because the server expects browser-like headers before it answers. Pass a real User-Agent and the NBA's own request headers, and always set a timeout so a stalled call fails fast instead of freezing your script:
import requests

STATS_HEADERS = {
    "Host": "stats.nba.com",
    "User-Agent": ("Mozilla/5.0 (Windows NT 10.0; Win64; x64) "
                   "AppleWebKit/537.36 (KHTML, like Gecko) "
                   "Chrome/124.0 Safari/537.36"),
    "Accept": "application/json, text/plain, */*",
    "Accept-Language": "en-US,en;q=0.9",
    "Referer": "https://www.nba.com/",
    "Origin": "https://www.nba.com",
    "x-nba-stats-origin": "stats",
    "x-nba-stats-token": "true",
    "Connection": "keep-alive",
}

# nba_api accepts a `headers=` argument on every endpoint;
# `timeout=30` means "give up after 30 seconds," not "wait 30 seconds."
leaders = leagueleaders.LeagueLeaders(
    season="2025-26",
    headers=STATS_HEADERS,
    timeout=30,
)
2. Don't hammer the server. If you're looping over players or games, put a short pause — half a second to a second — between calls, and wrap each call in a retry with exponential backoff so a single hiccup doesn't crash a long pull. A loop that fires a hundred requests as fast as Python can manage is exactly what gets you a temporary block. Sleep is cheap; getting rate-limited in the middle of a run is not.
3. Cache everything. This is the most important habit and the one people skip. The scoring leaders don't change between 2:00 and 2:05, so there is no reason to ask twice. Pull once, write the raw response to disk, and on every subsequent run read from the file instead of the network:
Pythonimport io, time
from pathlib import Path
import pandas as pd
CACHE = Path("data/raw")
CACHE.mkdir(parents=True, exist_ok=True)
def cached_df(key, producer, sleep_after=0.7):
"""Pull a DataFrame once, then serve it from disk forever after.
Delete the cached file to force a fresh pull."""
path = CACHE / f"{key}.json"
if path.exists():
return pd.read_json(io.StringIO(path.read_text(encoding="utf-8")),
orient="records")
df = producer() # the only line that hits the network
path.write_text(df.to_json(orient="records"), encoding="utf-8")
time.sleep(sleep_after) # be polite on the way out
return df
leaders = cached_df(
"leagueleaders_PTS_2025-26",
lambda: leagueleaders.LeagueLeaders(
season="2025-26", season_type_all_star="Regular Season",
stat_category_abbreviation="PTS", per_mode48="PerGame", timeout=30,
).get_data_frames()[0],
)Caching does three good things at once: it makes your work reproducible (the numbers don't shift under you between runs), it makes development fast (no waiting on the network every time you tweak a chart), and it makes you a good citizen (one request instead of a thousand). The full version of this pattern — headers, retries with backoff, on-disk caching, and a manifest that records where every number came from — is the helper that drives every script in this project. The specific script behind this article is scripts/nba_api_getting_started.py, and it does nothing more exotic than what you've read here.
Where to go next
You now have the whole loop: install the package, call an endpoint, get a DataFrame, sort it, and do it without annoying the server. That's genuinely 80% of what I do to build the data pieces on this site — the other 20% is knowing which stat to ask for, which is a basketball question, not a Python one. Swap "PTS" for "REB" or "AST" in the call above and you've got the rebounding or assist leaders; reach for LeagueDashPlayerStats with measure_type="Advanced" and you've got the raw material for an efficiency study. The API is undocumented and a little cranky, but it's free, it's complete, and it's ten lines away. Go ask it something.
Sources & Further Reading
- Theory: Chapter 3: Python Environment Setup — a free chapter at DataField.dev.
- Data source: NBA.com/stats — the (undocumented) stats endpoints this whole tutorial talks to.
- The Python package: nba_api on GitHub, whose README is the closest thing to a full endpoint reference.
- The runnable code for this article lives in
scripts/nba_api_getting_started.py(LeagueLeaders, PTS, PerGame; 2025-26, retrieved June 2026).