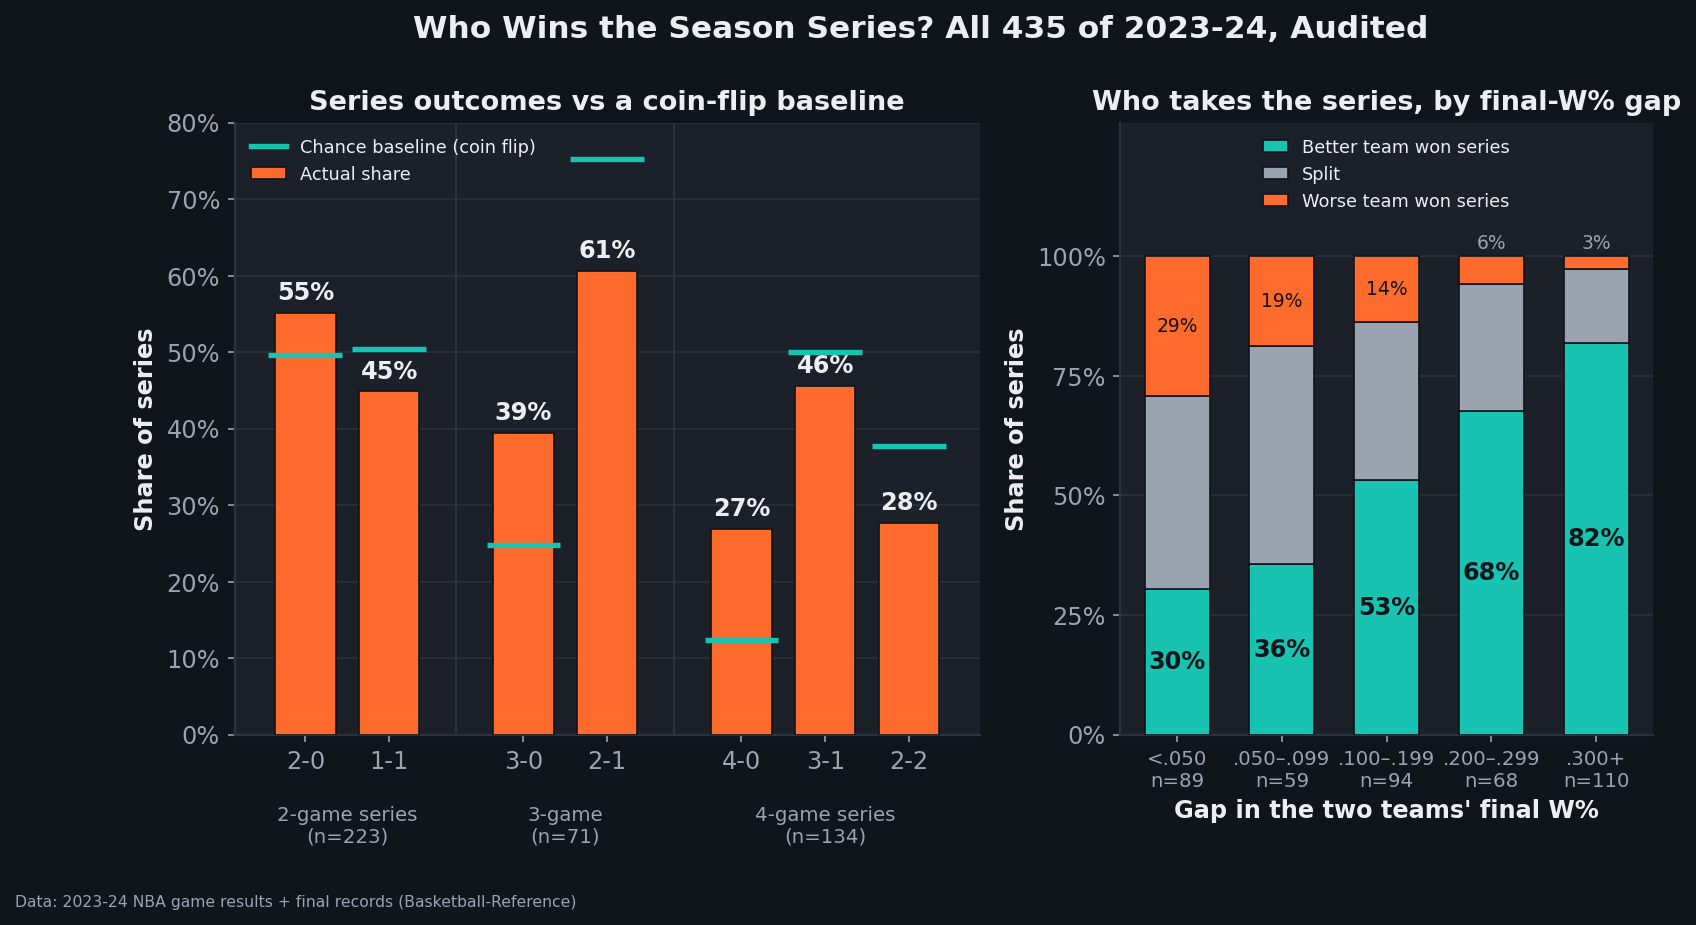
Every NBA broadcast treats the season series as a verdict — "Boston took the series 3-0, so they match up well" — and every seeding tiebreaker enshrines it in law. So we audited all of them: 435 head-to-head series rebuilt from the 1,230 regular-season games of 2023-24, joined to each team's final record. Measured against an honest coin flip, the season series is a loud verdict — 64 sweeps of the 3- and 4-game series where chance predicts 34 — and still a coarse one: give one team a .100 edge in final winning percentage and it took the series outright only 68.4% of the time. It split 24.3% and lost the thing outright 7.4% — including a 22-60 Spurs team taking the series 3-1 from the 49-33 Suns. Talent shows up loudly in 435 series at once. In any single one of them, two to four games is still two to four games.
What counts as a series here
The bundled game log has 1,231 rows, and one of them is not a regular-season game: the In-Season Tournament final of December 9, 2023 (Pacers 109 at Lakers 123), which the league does not count in the standings. We dropped it. The remaining 1,230 games put every team at exactly 82, which is the audit passing itself. Pairing off the 30 teams gives 435 head-to-head series:
| Meetings | Pairs | Structural reason |
|---|---|---|
| 2 games | 223 | inter-conference pairs, one game per building |
| 3 games | 71 | same-conference pairs on the short rotation (69), plus two cross-conference oddities |
| 4 games | 134 | division rivals and the rest of the conference slate |
| 5 games | 7 | 2023-24's tournament wrinkle (below) |
The textbook scheduling formula has no five-game series, but 2023-24 was the first In-Season Tournament year, and the knockout rounds counted as regular-season games layered onto the base schedule. The data confesses this on its own: all seven five-meeting pairs contain a game dated December 4-8, the knockout-and-consolation window. Celtics-Pacers, Bucks-Knicks, Lakers-Suns, Pelicans-Kings, Pacers-Bucks, Celtics-Knicks, Suns-Kings: those rivalries got a fifth chapter. The same window explains the two cross-conference pairs that met three times instead of the usual two — Pistons-Grizzlies and Bulls-Spurs each have one meeting dated December 6 or 8. One more bookkeeping note: 15 of the 435 pairs finished with identical records, so any question about "the better team" runs on the other 420.
The shape of a series, against an honest coin flip
Before asking whether the right team wins, we want to know how decisive series are at all — compared to what pure chance would produce. Our baseline is deliberately crude: every game is a weighted coin flip where the home team wins with probability 54.3%, the overall home-win rate in this dataset (668 of 1,230), applied to each pair's actual home/away split and enumerated exactly. No team strength anywhere in it — that is the point. Whatever the baseline can't explain is the part talent has to be doing.
| Series length | Outcome | Actual | Share | Coin-flip baseline |
|---|---|---|---|---|
| 2 games (223) | 2-0 | 123 | 55.2% | 49.6% |
| 1-1 split | 100 | 44.8% | 50.4% | |
| 3 games (71) | 3-0 sweep | 28 | 39.4% | 24.8% |
| 2-1 | 43 | 60.6% | 75.2% | |
| 4 games (134) | 4-0 sweep | 36 | 26.9% | 12.3% |
| 3-1 | 61 | 45.5% | 50.0% | |
| 2-2 split | 37 | 27.6% | 37.7% |
The seven five-game series went one 5-0, two 4-1, four 3-2 — and the 5-0 deserves its line: New Orleans beat Sacramento all five times, by 36, 5, 10, 33, and 12. Sacramento, meanwhile, swept the Lakers 4-0 despite finishing a game behind them — the only 4-0 in the season delivered by the team with the worse final record. The food chain does not run in a straight line.
data_layer/nba_home_results.csv and data_layer/nba_ratings.csv, 2023-24 regular season (Basketball-Reference); chart by chart_season_series.py, baseline recomputed from the same file.Sweeps run at double chance
Pool the 3- and 4-game series: 64 of 205 ended in a sweep, 31.2%, against a baseline of 16.6% — 34.1 expected sweeps versus 64 observed, which is 5.6 standard errors of daylight. Split by length, the excess is +2.9 SE for 3-game series and +5.1 SE for 4-game series. And the mirror image is just as telling: every competitive outcome came in under chance. The baseline wanted 50.5 of the 4-game series to end 2-2; only 37 did. It wanted 75.2% of 3-game series at 2-1; 60.6% obliged. A coin has no memory, but a 25-win gap between rosters persists from October to April, so the same team keeps winning the same matchup. Only the 2-game series look nearly flip-like (55.2% decided against 49.6% expected, +1.7 SE) — and even there the excess points the same way; two games is simply too short a series for talent to speak clearly over the venue trade.
The sweep gallery reads mostly as it should: Boston 4-0 over Washington across a .598 gap in winning percentage, Boston 3-0 over Detroit across .610 — the widest gap in the league — Miami, Milwaukee, Philadelphia, Indiana, Orlando, and Cleveland all sweeping Detroit or Washington. But 28 three-game sweeps include four where the sweeper had the worse final record, and one of them is genuinely strange: Phoenix swept Minnesota 3-0 — a 49-33 team erasing a 56-26 team from its own schedule. The season series and the standings are allowed to disagree, and a few times a year they do it emphatically.
Does the better team take the series?
Now the payoff question. Take the 420 pairs with distinct final records, call the team with the better final winning percentage "better," and ask who took the head-to-head:
| Final-W% gap | Series | Better team won | Split | Worse team won |
|---|---|---|---|---|
| under .050 | 89 | 30.3% | 40.4% | 29.2% |
| .050–.099 | 59 | 35.6% | 45.8% | 18.6% |
| .100–.199 | 94 | 53.2% | 33.0% | 13.8% |
| .200–.299 | 68 | 67.6% | 26.5% | 5.9% |
| .300 and up | 110 | 81.8% | 15.5% | 2.7% |
Across all 420, the better team took the series outright 55.7% of the time, split 30.7%, and lost it 13.6%. At a gap of .100 or more — call it eight-plus wins over a season, a difference nobody disputes — the better team's outright rate is 68.4% (±2.8), with 24.3% splits and 20 outright series losses in 272. Two things about that number. First, it is lower than the better team's single-game win rate in the same matchups — game by game, teams .100 apart saw the better side win 76.4% of 772 games — because the series adds a third outcome, the split, that eats probability without crowning anyone. 137 of the 435 series, 31.5%, ended 1-1 or 2-2 and answered nothing. Second, when the series did pick a winner at a .100+ gap, it picked correctly 90.3% of the time (186 of 206). The season series' problem isn't that it lies; it's that a quarter of the time it refuses to testify. That division of labor matches what we found when "better" was defined by net rating a game at a time (67.9% overall there; 67.6% here by final record): the signal is real, the sample is the constraint.
The upset tail
The worst-case exhibit, and 2023-24 supplied a tie at the top. Two series were won outright by a team that finished a full .329 of winning percentage — 27 wins — below its opponent: San Antonio (22-60, .268) took its series with Phoenix (49-33, .598) three games to one, and Charlotte (21-61, .256) took Cleveland (48-34, .585) two games to one. Just behind them: Portland (21-61) went 2-0 against Indiana (47-35), a .317 gap. And Milwaukee, a 49-33 team, managed to lose season series outright to Toronto (25-57), Memphis (27-55), and Utah (31-51). The Hornets-Cavaliers series has a timing footnote the data volunteers: all three meetings landed between March 25 and April 14, the season's last three weeks. We can't see rosters or minutes in this file, so we won't pretend to explain late-season games; we can only note that the schedule concentrated that particular referendum at a peculiar time and the record book doesn't care.
Worked example: Spurs–Suns, four games, three points
The biggest upset deserves its ledger walked end to end. Here are all four meetings, straight from the game log:
| Date | Result | Winner | Margin |
|---|---|---|---|
| 2023-10-31 | Spurs 115 at Suns 114 | San Antonio | +1 |
| 2023-11-02 | Spurs 132 at Suns 121 | San Antonio | +11 |
| 2024-03-23 | Suns 131 at Spurs 106 | Phoenix | +25 |
| 2024-03-25 | Suns 102 at Spurs 104 | San Antonio | +2 |
San Antonio won the series 3-1 while Phoenix outscored San Antonio 468 to 457 across the four games. Two of the three Spurs wins came by a combined three points; flip those two coin-toss finishes and the 22-60 team loses the series 1-3, which is exactly the sentence the final records would have written. The series verdict and the scoreboard aggregate looked at the same four games and disagreed. If that sounds familiar, it should: a single game's margin is mostly noise, and a season series is only two to four of them stapled together. The tiebreaker rulebook treats 3-1 as information. The point differential mutters otherwise.
Limits of this read
- One season. 435 series is a healthy count of series, but it is still one schedule, one injury map, one year. The sweep excess is too large to be a fluke; the exact bin percentages will wobble.
- The baseline is deliberately dumb. Constant 54.3% home-win probability, each pair's real venue split, no team strength. We kept it that way on purpose: the baseline's job is to say what venue plus luck alone produce, so that everything above it is attributable to persistent quality. A strength-adjusted baseline would bake the conclusion into the null. The cost of the simplicity: the baseline slightly understates how decisive series between unequal teams should be, which makes the sweep excess easier to achieve. The honest headline is the direction and the order of magnitude, not the 5.6.
- Final records are hindsight, and they contain the series itself. "Better team" means better by the season's end, judged partly on the very head-to-head games being scored — win a series 3-1 and you've nudged both final records apart. Over 82 games the circularity is small; it is not zero, and it flatters the agreement between gap and verdict.
- Meeting counts aren't random. Division rivals meet four times, cross-conference teams twice, and in 2023-24 the tournament added a fifth game for seven pairs, per the schedule's usual unfairness. Comparing 2-game verdicts to 4-game verdicts is comparing different instruments. Venue balance isn't guaranteed either: New York hosted all three Detroit meetings, and the Nuggets-Clippers series ran 1-3 on hosting. The baseline absorbs venue per pair; the "series" as a concept does not.
- A third of series answer nothing. 1-1 and 2-2 have no winner — 137 of 435 series ended that way. The league breaks such ties with further rules when seeding demands it; we left them as what they are, non-answers.
Reproduce it
The whole audit is a groupby over one CSV plus one exact enumeration. Core computation:
import pandas as pd
from collections import defaultdict

g = pd.read_csv("data_layer/nba_home_results.csv")
g = g[~((g.date == "2023-12-09") & (g.away_team == "Indiana Pacers")
        & (g.home_team == "Los Angeles Lakers"))]   # IST final: not regular season
r = pd.read_csv("data_layer/nba_ratings.csv")
pct = dict(zip(r.Team, r.W / (r.W + r.L)))

wins = defaultdict(lambda: defaultdict(int))
for _, x in g.iterrows():
    k = tuple(sorted([x.home_team, x.away_team]))
    wins[k][x.home_team if x.home_pts > x.away_pts else x.away_team] += 1

for (a, b), w in wins.items():
    gap = abs(pct[a] - pct[b])
    verdict = "split" if w[a] == w[b] else (a if w[a] > w[b] else b)
    # tally verdict vs the higher-pct team, bucket by gap ...
The chance baseline enumerates each pair's win-count distribution from a constant home-win probability (the file's overall 54.3%) applied to that pair's actual venue split; chart_season_series.py recomputes it from scratch every time the chart is built. Nothing is hand-entered.
Sources & method
- Game-by-game results: bundled
data_layer/nba_home_results.csv— 1,231 rows covering 2023-24, of which the 2023-12-09 In-Season Tournament final (Pacers at Lakers) is excluded as a non-regular-season game, leaving all 1,230 regular-season results. Underlying data: Basketball-Reference. - Final records: bundled
data_layer/nba_ratings.csv(30 teams, final W-L); winning percentage computed as W/(W+L). All figures computed 2026-07-21; the chart ischart_season_series.py. - Uncertainty: binomial standard errors on outcome shares; the sweep comparison uses the baseline share as the null.
- Related on this site: how often the better team wins a single game · the biggest home-court edges of 2023-24 · how much of an NBA game is luck.