When we priced the back-to-back penalty — a team that played yesterday wins 41.9% against a rested opponent and gives up 2.8 points of margin — we left the broadcasters' second-favorite excuse on the table: "third game in four nights." So we went back to the 2023-24 schedule and counted every team's trailing four-night window. The raw result looks like more fatigue: a team on its third game in four nights won just 43.8% against a normally-rested opponent and lost by 2.1. But split that bucket open and the entire effect is the back-to-back hiding inside it. A second night of a back-to-back that is also a third-in-four costs −2.39 points of margin; a plain second night costs −2.35. Five hundredths of a point. In this league, fatigue is a yesterday tax, not a running tab.
How we measured it
Same machinery as the back-to-back piece: the bundled game log has nothing but dates, teams, and scores, and the dates are enough. For each of the 2,462 team-games of 2023-24 we counted how many games the team played in the four calendar nights ending that night, tonight included — call it the density. A density of 3 is the classic "three in four." We did the same for a six-night window, and we flagged the plain back-to-back (played yesterday) separately, because the whole question is whether density adds anything beyond that flag.
One structural fact worth stating up front, because it shapes everything: every three-in-four contains a back-to-back. Three games in four nights forces two of them onto consecutive nights — that's just the pigeonhole principle. So "3-in-4" is never a separate species of tired; it is a back-to-back plus one more game in the neighborhood. The real question is whether that extra game matters, and the schedule runs the experiment for us: 294 of the season's 614 third-in-four team-games fell on the second night of the back-to-back, and 320 fell the day after it, with an off day in between.
First pass: density alone barely registers
| Schedule spot (4-night window) | Team-games | Win rate | Avg margin |
|---|---|---|---|
| 1st game in 4 nights | 143 | 49.7% | +0.4 |
| 2nd game in 4 nights | 1,705 | 51.4% | +0.5 |
| 3rd game in 4 nights | 614 | 46.1% | −1.4 |
Nobody played four in four; the modern schedule tops out at three. The dip only appears at the top of the range, and it is modest: 46.1% with a standard error of two points, a −1.4 margin with an SE of 0.65. The six-night window says the same thing more quietly — the fourth game in six nights ran 48.3% with a −1.2 margin (n=704), and lighter weeks all sit within a point of even. If accumulating fatigue were a force of its own, this is where it would show up. It shows up as a whisper.
The two-sided view — and a correction of our own framing
Density, like rest, only means something relative to the other bench. So we built the same rest-matchup design as the back-to-back piece, but two-sided by density: your window against your opponent's window.
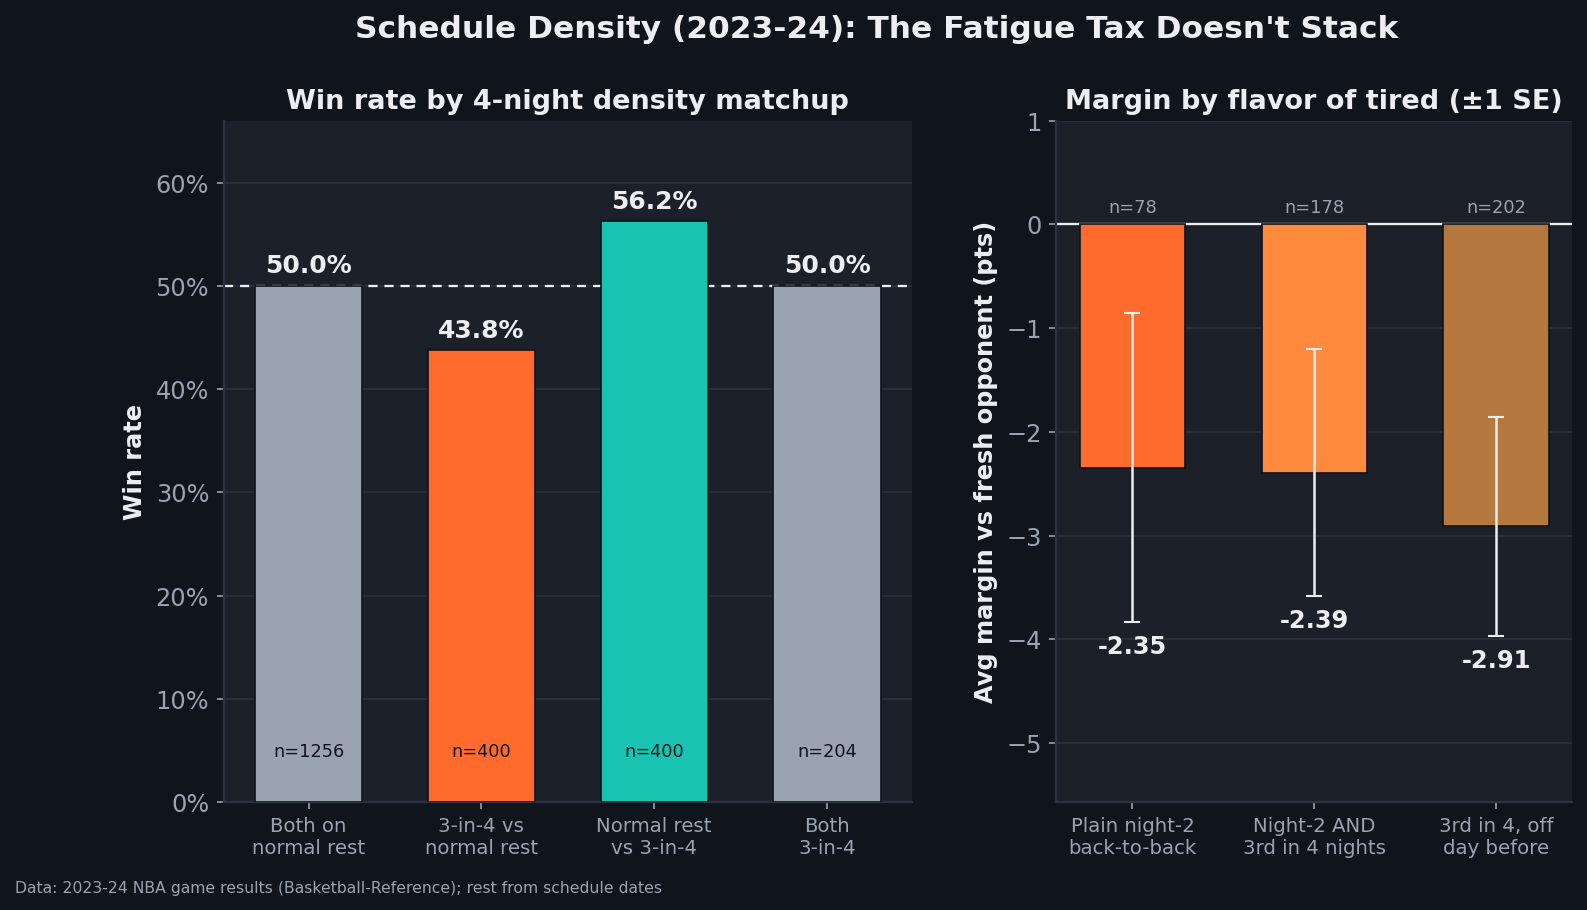
A 3-in-4 team facing an opponent on a normal two-in-four won 43.8% (n=400, SE 2.5) and lost by 2.13 (SE 0.79); the mirror image, of course, won 56.2%. That is a real edge — about three-quarters the size of the one-sided back-to-back penalty — and it is the honest headline number for "three in four nights."
A design note, because we owe it after the last piece. In a two-sided count like this one, the equal-rest buckets must land on exactly 50% — every game inside them contributes one winner-row and one loser-row, so 50.0% is arithmetic, not evidence. In the back-to-back article we leaned on "both tired is back to a coin flip" as the tell that rest is a differential. The differential conclusion stands, but the correct support for it is the mismatch buckets and their symmetry, not the 50s. Here we'll say it plainly: the gray bars in the chart carry no information. The orange and teal ones carry all of it.
The decomposition: does the third game add anything?
Now the question this article exists for. Take every tired team-game against a comparably fresh opponent — opponent not on a back-to-back and not on a 3-in-4 — and split "tired" into its three flavors:
| Flavor of tired (vs fresh opponent) | Team-games | Win rate | Avg margin (±SE) |
|---|---|---|---|
| Plain night-2 of a back-to-back | 78 | 46.2% | −2.35 (±1.49) |
| Night-2 that is also a 3rd-in-4 | 178 | 40.4% | −2.39 (±1.19) |
| 3rd-in-4 with an off day before | 202 | 44.1% | −2.91 (±1.06) |
Read the margin column first, because it is the stable one. Stacking a third-in-four on top of a second night moves the average margin from −2.35 to −2.39 — a difference of 0.05 points with a standard error of 1.9. That is as close to a textbook null as one season of basketball can produce. The win-rate column looks noisier — 46.2% versus 40.4% — but that 5.7-point gap carries a 6.7-point standard error, and it flips sign under other reasonable cuts (over all opponents, the two flavors win 43.8% and 44.2%). There is no version of this split in which the third game adds a detectable cost on top of the second night.
The six-night window agrees. A fourth game in six nights with no back-to-back involved — a heavy week played on rest days — ran 50.6% with a −0.6 margin across 464 team-games. Free. And a back-to-back embedded in a heavy week (4-in-6) cost about the same as one in a light week: −2.3 versus −1.7, win rates 43.8% and 44.5%, differences well inside one standard error. However we slice it, the schedule's fatigue tax is levied once, on the morning after, and the taxman does not compound.
The one wrinkle: the day-after echo
There is one bucket we can't fully dismiss: the third-in-four with an off day before it — a team that finished a back-to-back, rested a day, and plays again. Against fresh opponents it ran −2.91 (SE 1.06); in the cleanest two-sided control (3-in-4 versus normal rest, tired team not on a back-to-back) it ran 46.7% and −1.93 (n=214, SE 1.05); over all opponents, 47.8% and −1.07. So the day-after-a-back-to-back estimate wobbles between about one and three points depending on how we condition, always negative, never conclusively so. If accumulation exists anywhere, it is here — a lingering echo the size of home court or smaller, one rest day not being quite a full reset. One season cannot pin it down, and we won't pretend it can. What one season can say: the echo, if real, is no larger than the live effect, and the live effect itself is only a field goal.
Limits of this read
- The decisive buckets are small. The decomposition rests on 78, 178, and 202 team-games. That is enough to rule out a large stacking effect — a second fatigue penalty the size of the first would put the stacked bucket near −4.7, about two standard errors below the −2.39 we measured — but not enough to rule out a small one.
- No travel, no minutes. "Played last night" and "played three times this week" are calendar proxies. A 3-in-4 across three time zones is surely not the same as one spent at home, and none of that is in the file.
- Star rest is folded in. Some of the measured penalty is coaches sitting players on the nights we're calling tired — that is part of what a dense schedule costs, but it is not the same mechanism as tired legs. See load management for why teams make that trade.
- Schedule assignment isn't random. The league spreads back-to-backs roughly evenly, but not perfectly, and dense stretches cluster in certain months. Some bucket-to-bucket noise is matchup quality, not fatigue. And with single-game margins as noisy as they are, a ±1-point effect needs several seasons to nail.
- One season. 2023-24 only. The sign pattern is intuitive and internally consistent, but the decimals will wobble year to year.
The takeaway
The excuse hierarchy, priced from one season of schedule: playing last night costs about 2.4 points against a fresh opponent, whatever else surrounds it. Playing a lot this week, on rest days, costs nothing measurable. The dreaded three-in-four is real but derivative — it hurts because it contains a back-to-back, plus perhaps a faint day-after echo we can't certify. So when the broadcast stacks the excuses — "second night of a back-to-back and their third game in four nights" — the data says the second clause is decoration. The calendar matters, but only the last page of it. That is genuinely useful: it means "tired" is a one-day condition you can see coming, about the size of an average home court, and it resets faster than the narrative does.
Reproduce it
Rebuild each team's schedule from the game dates; for every team-game count games in the trailing 4- and 6-night windows and flag "played yesterday"; then split by the two-sided density matchup and, within the tired buckets, by back-to-back status, averaging wins and margins in each cell. The chart is regenerated by chart_schedule_density.py against the bundled data_layer/nba_home_results.csv — no network, nothing hand-entered.
Sources & Further Reading
- Game-by-game results: bundled
data_layer/nba_home_results.csv(1,231 real 2023-24 games), density derived from the dates bychart_schedule_density.py. Underlying data: Basketball-Reference. - Related: The back-to-back penalty — the predecessor piece; the one-sided effect this article decomposes.
- Related: Rest, back-to-backs, and load management — the roster-management side of the same calendar.
- Related: How much of an NBA game is luck? — why point-sized effects need big samples.